Vesper  Updates

New Vesper Price Index: Shea Butter & Derivatives

by Feiko Keilholz, Product Marketing
New
Cocoa
Oils & Fats
Chocolate, Confectionery & Ice Cream
Vesper Price Index (VPI)

Vesper has expanded its proprietary Shea & Cocoa equivalent fats coverage with 10 new Vesper Price Index (VPI) benchmarks for Shea butter and its derivatives. Published weekly, these benchmarks combine inputs from renowned brokers to bring transparency to one of the most opaque supply chains in the market.

What's New:

  • Expanded Shea Coverage: Weekly benchmarks for Crude, Semi-Refined, Handmade, Shea Olein, and Shea Oil across key West African origins (Ghana, Burkina Faso).

  • Broad Market Input: Prices derived from renowned brokers, combining inputs from multiple partners to ensure robust and unbiased market representation.

Why It Matters:

Public price transparency for Shea is extremely limited, leaving procurement teams to rely on fragmented signals or single-source quotes. These proprietary VPIs provide the independent reference needed to verify quotes in a notoriously non-transparent market. Especially with Cocoa price movements of the past years, this was a much-requested product from our users

How to Use It:

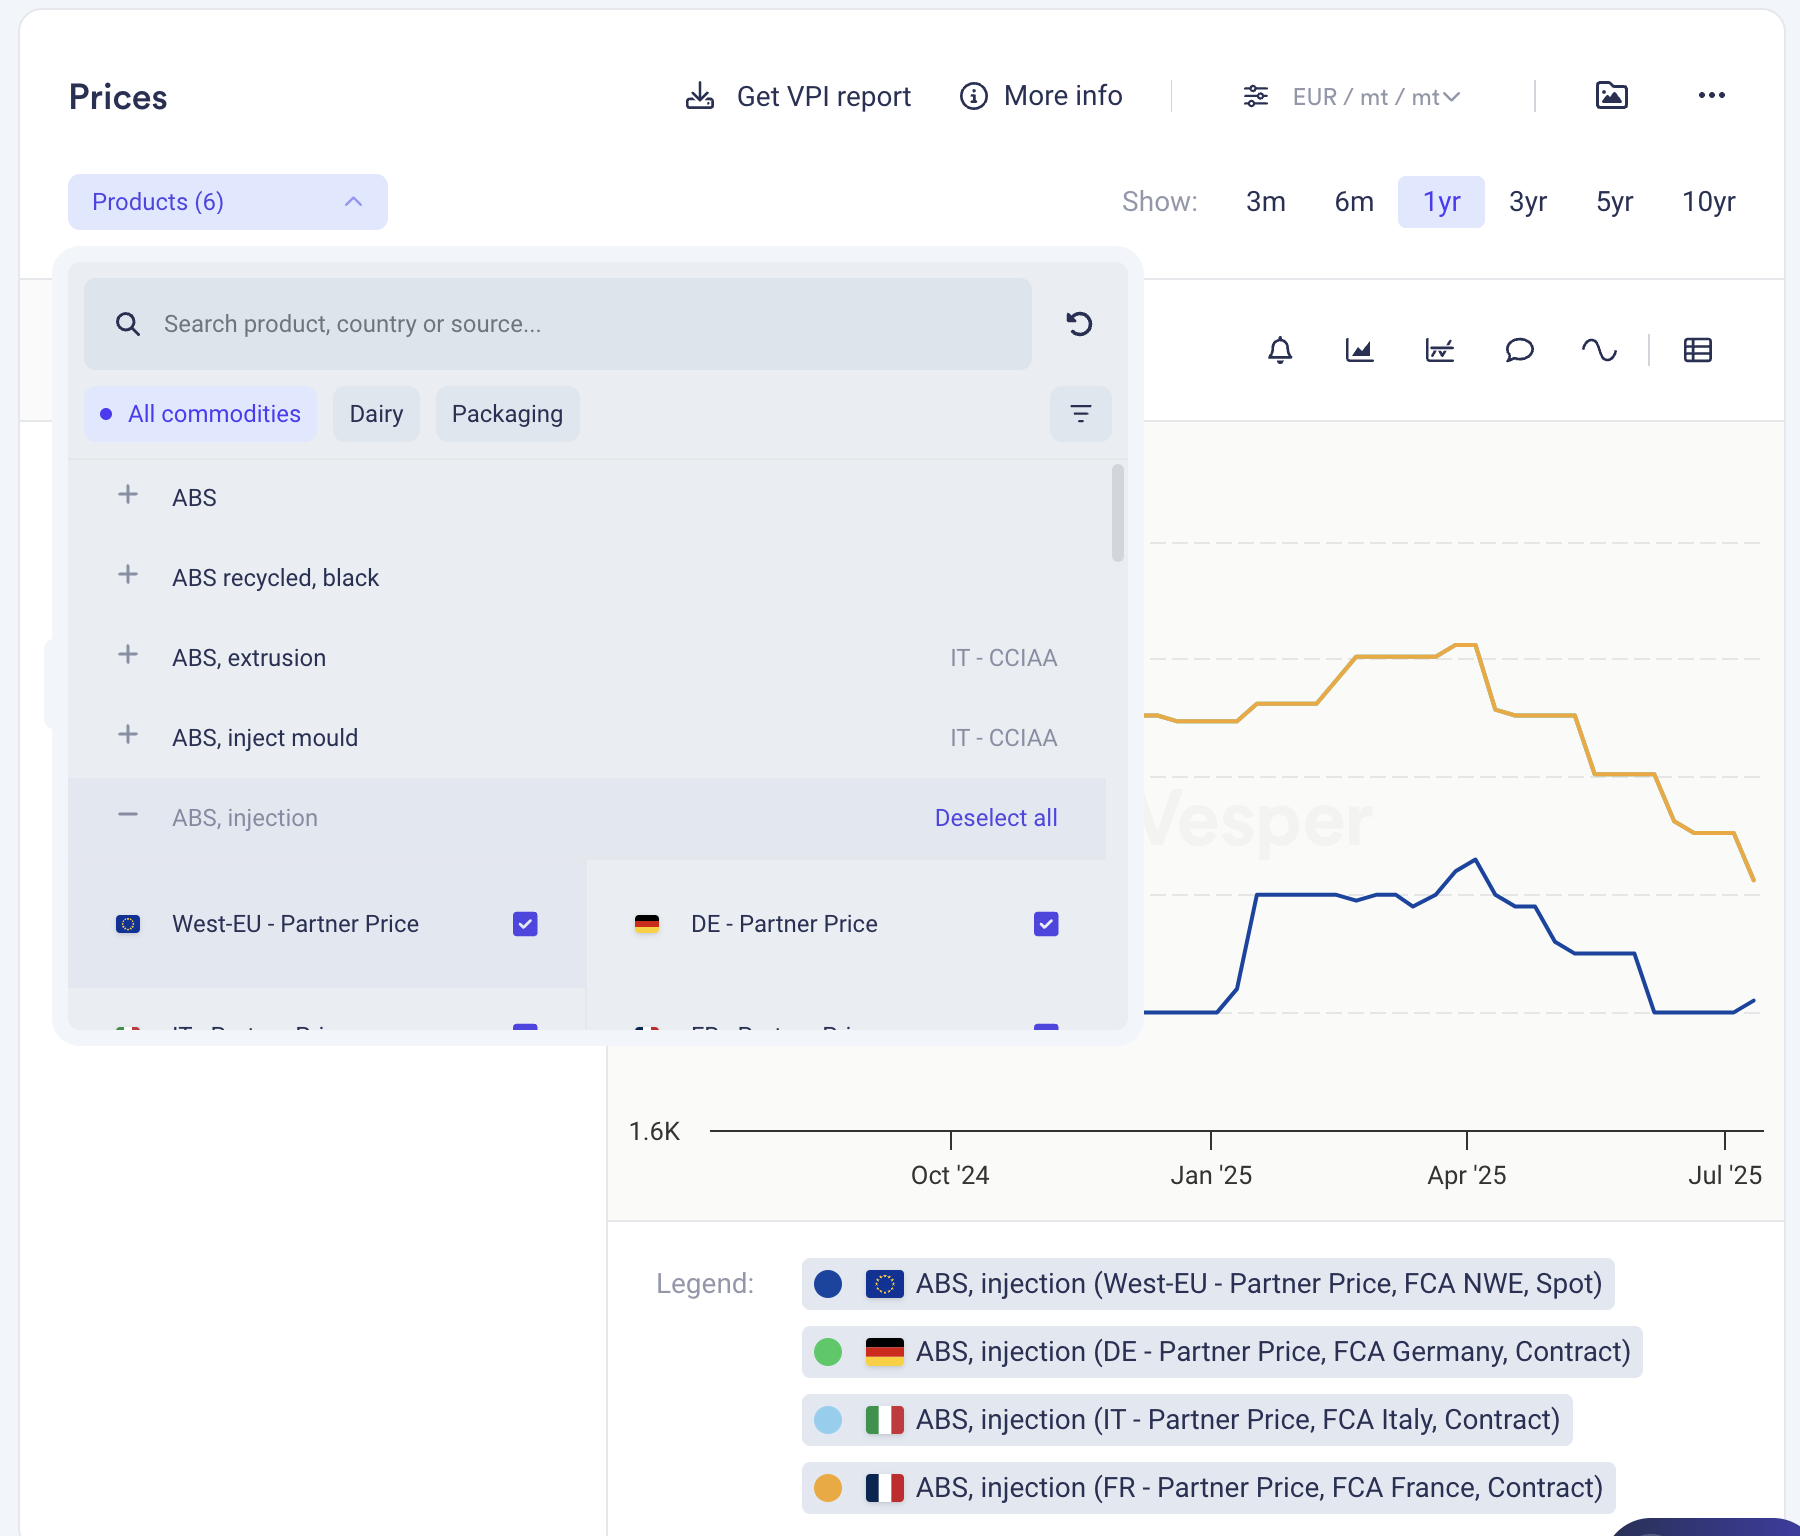
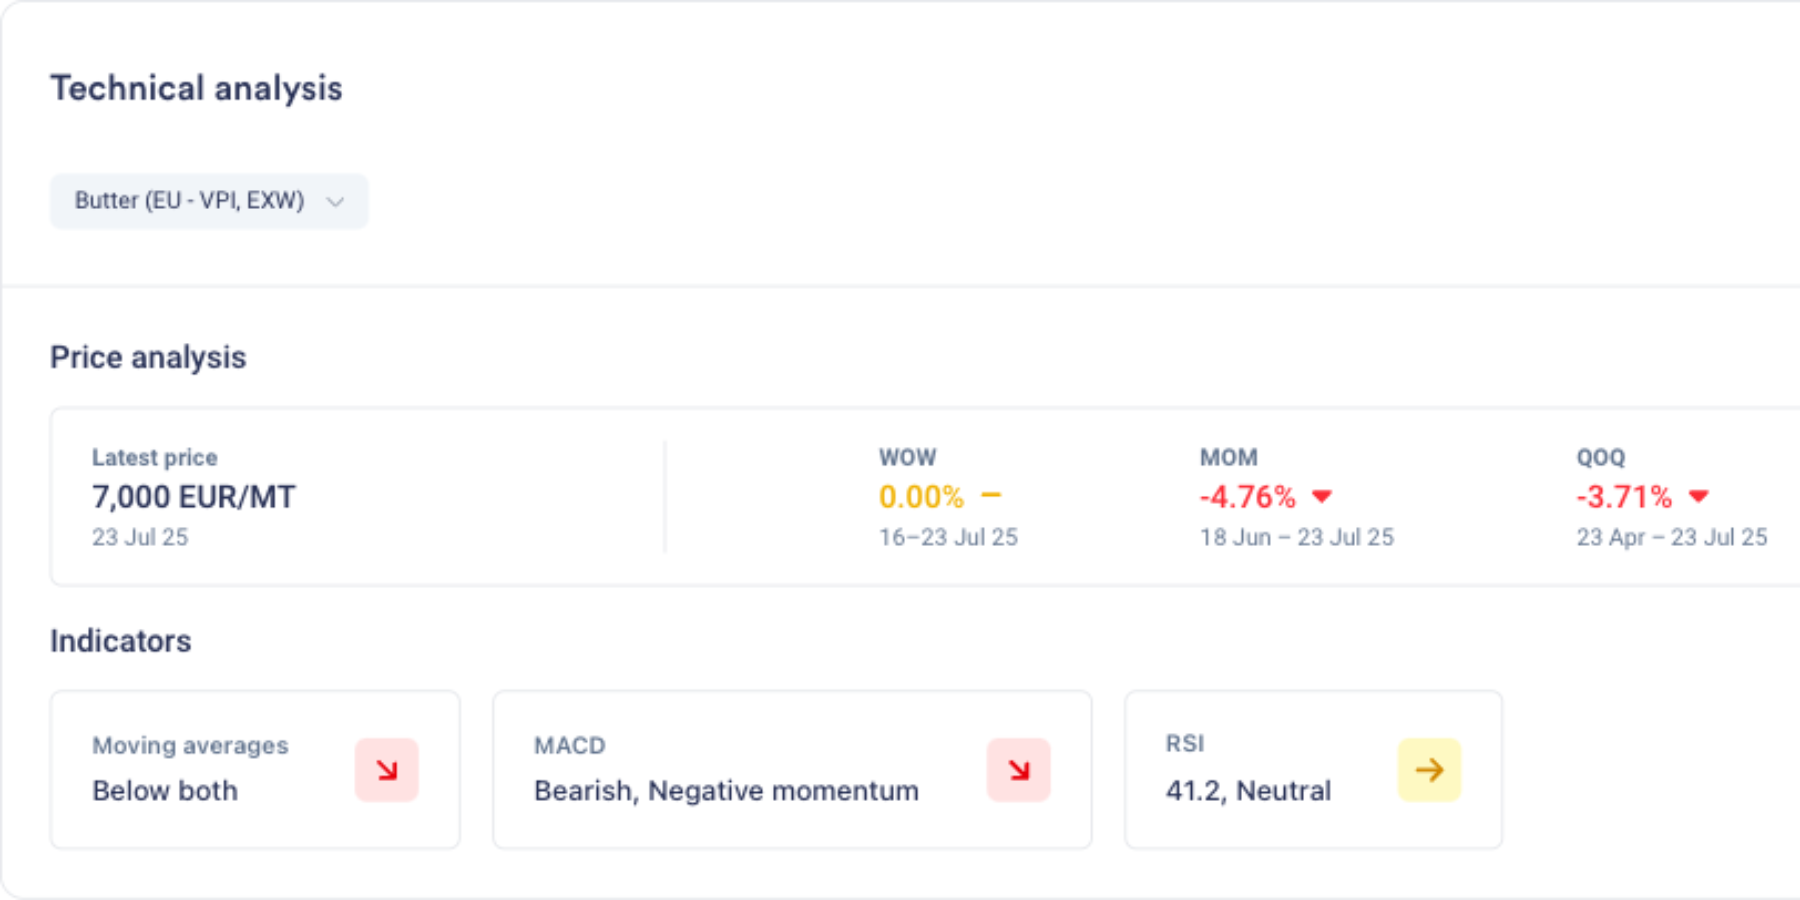
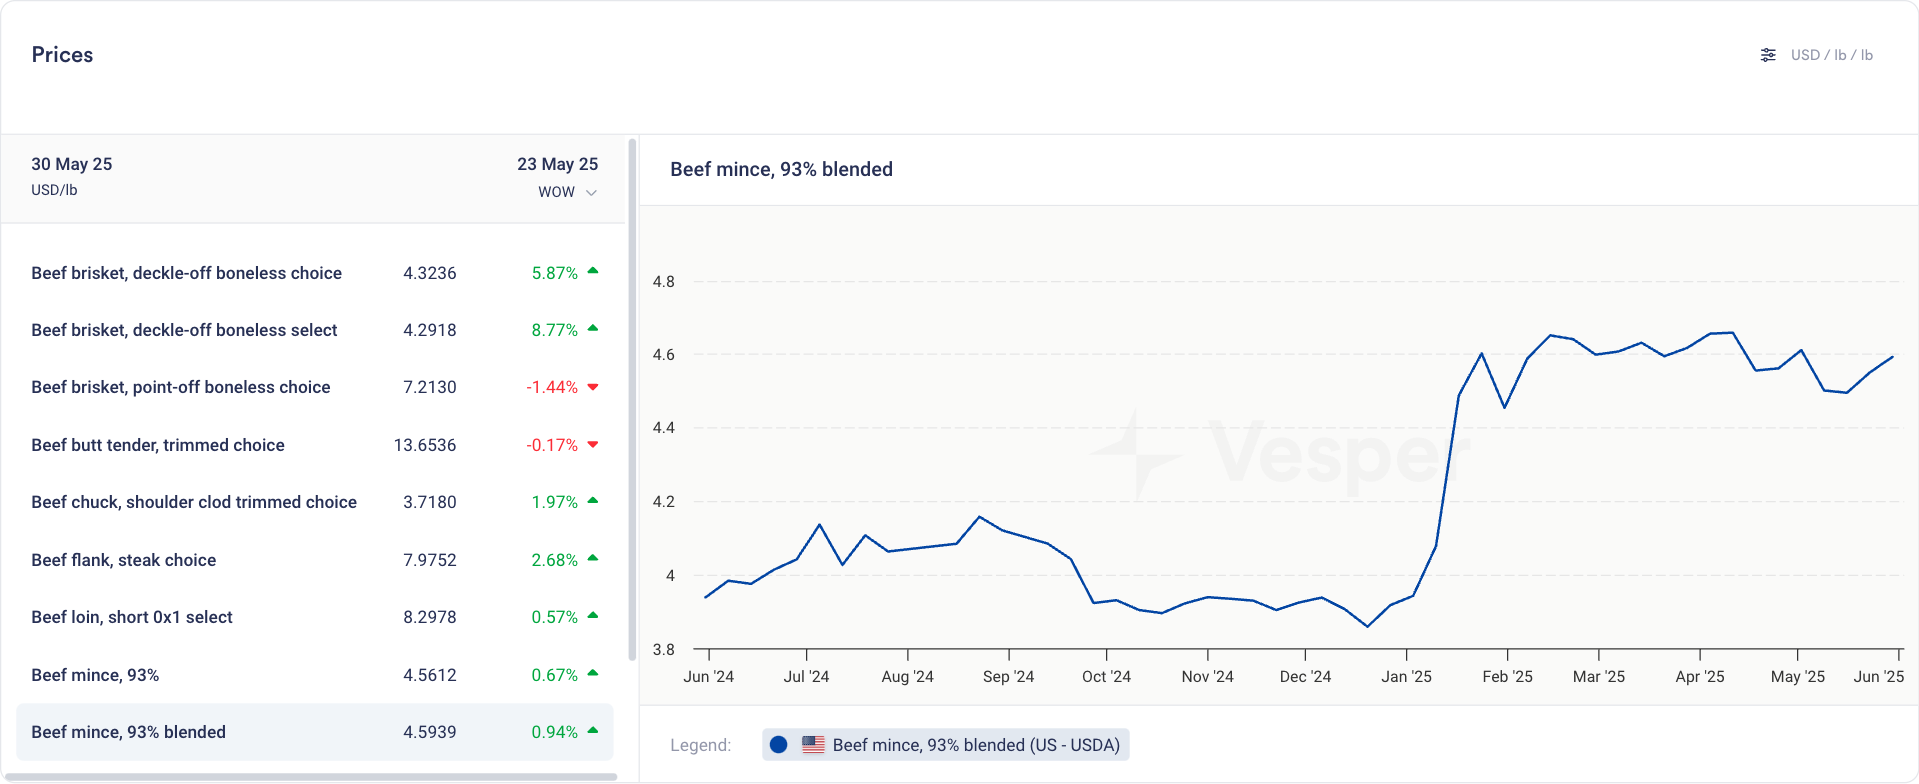
  • Prices Widget: Bookmark specific grades (e.g., Shea Stearin, Crude Shea Butter) for one-click access to the latest weekly prices.

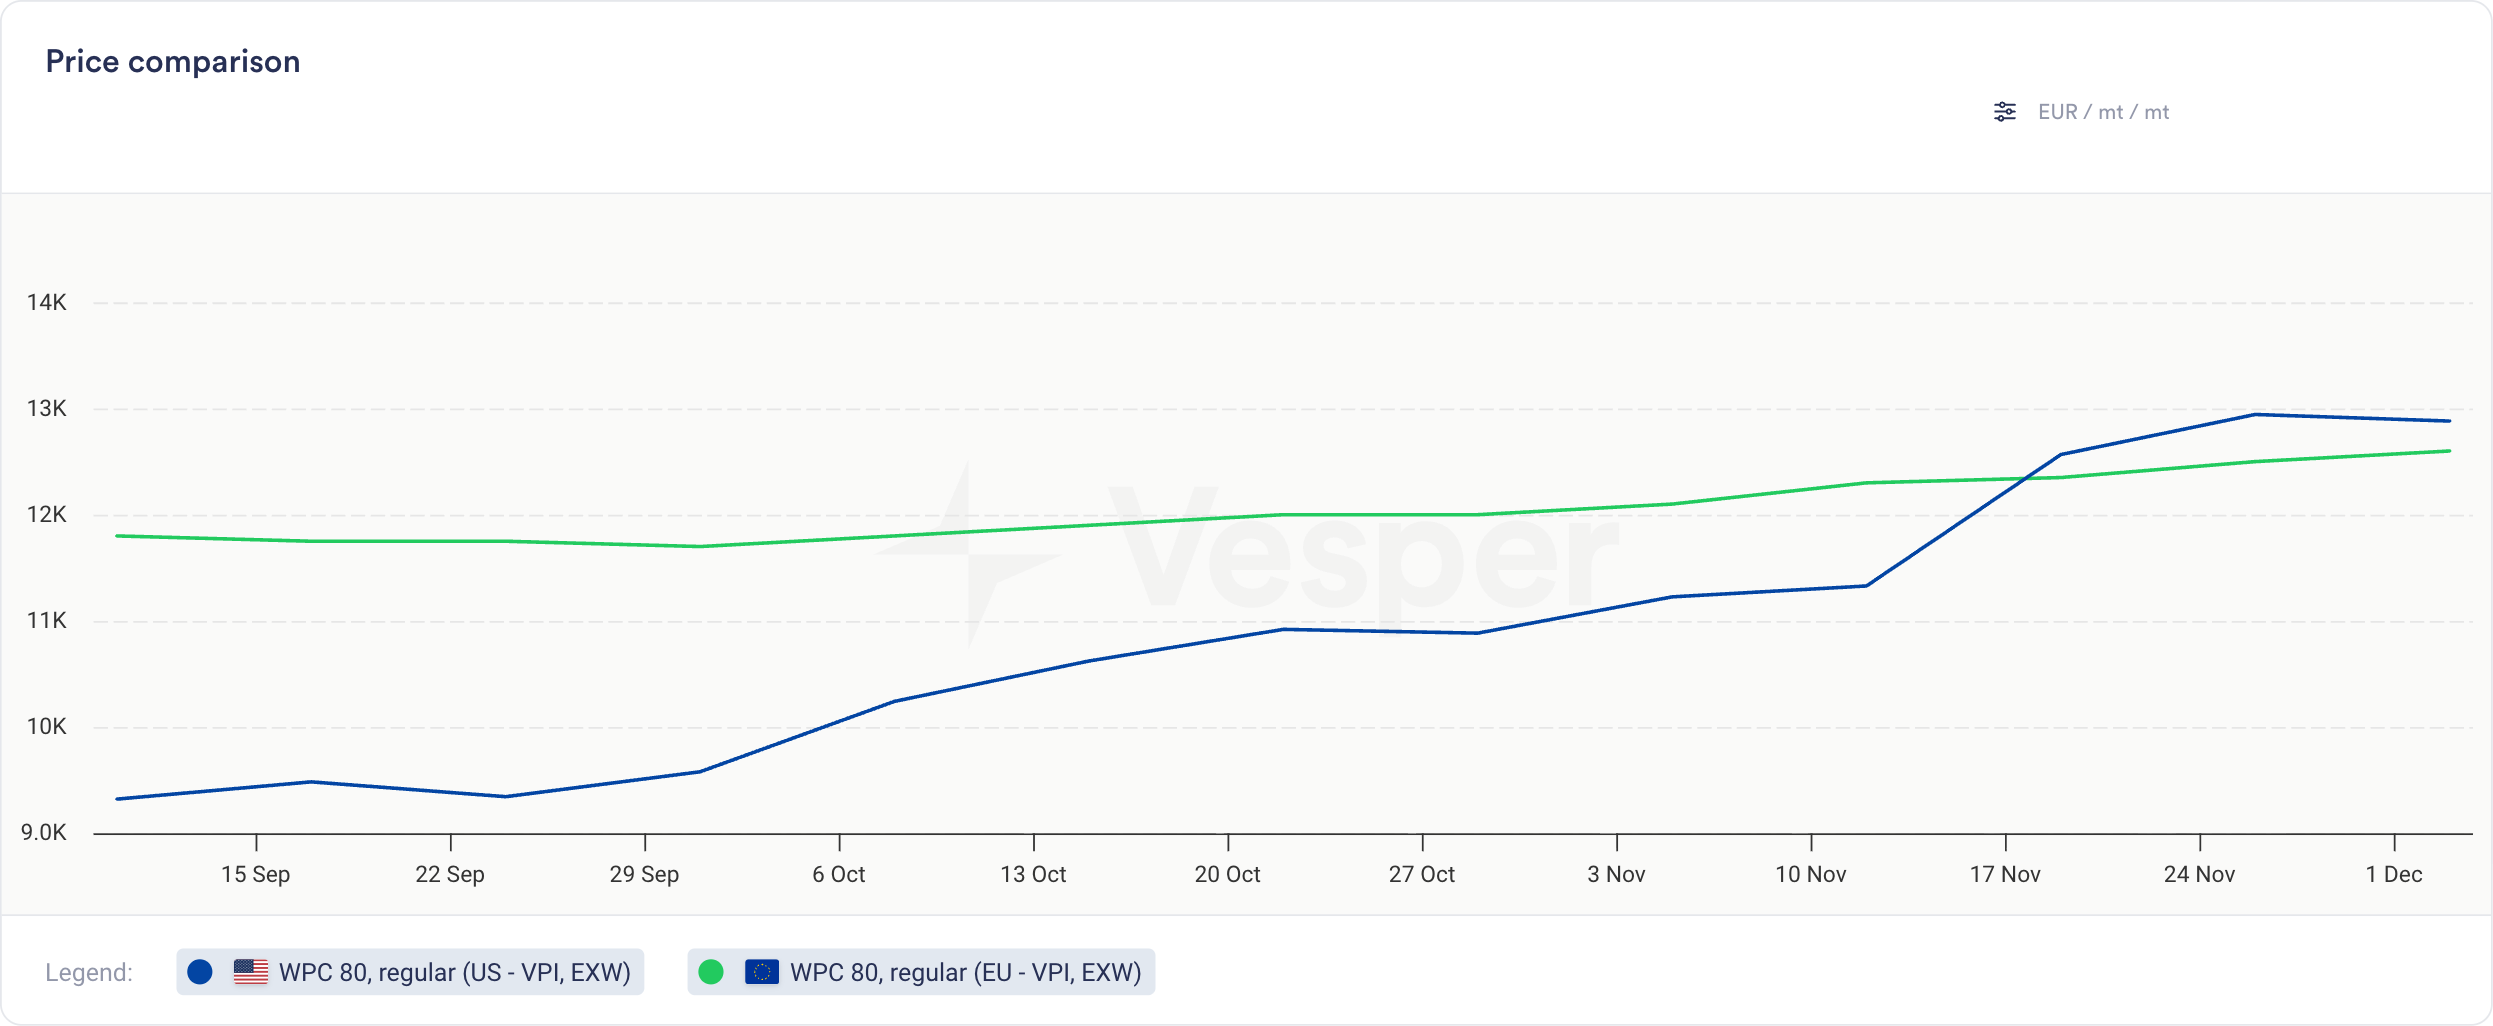
  • Price Comparison: Compare different processing stages (e.g., Crude vs. Semi-Refined) to identify value opportunities and spot diverging trends between product types.

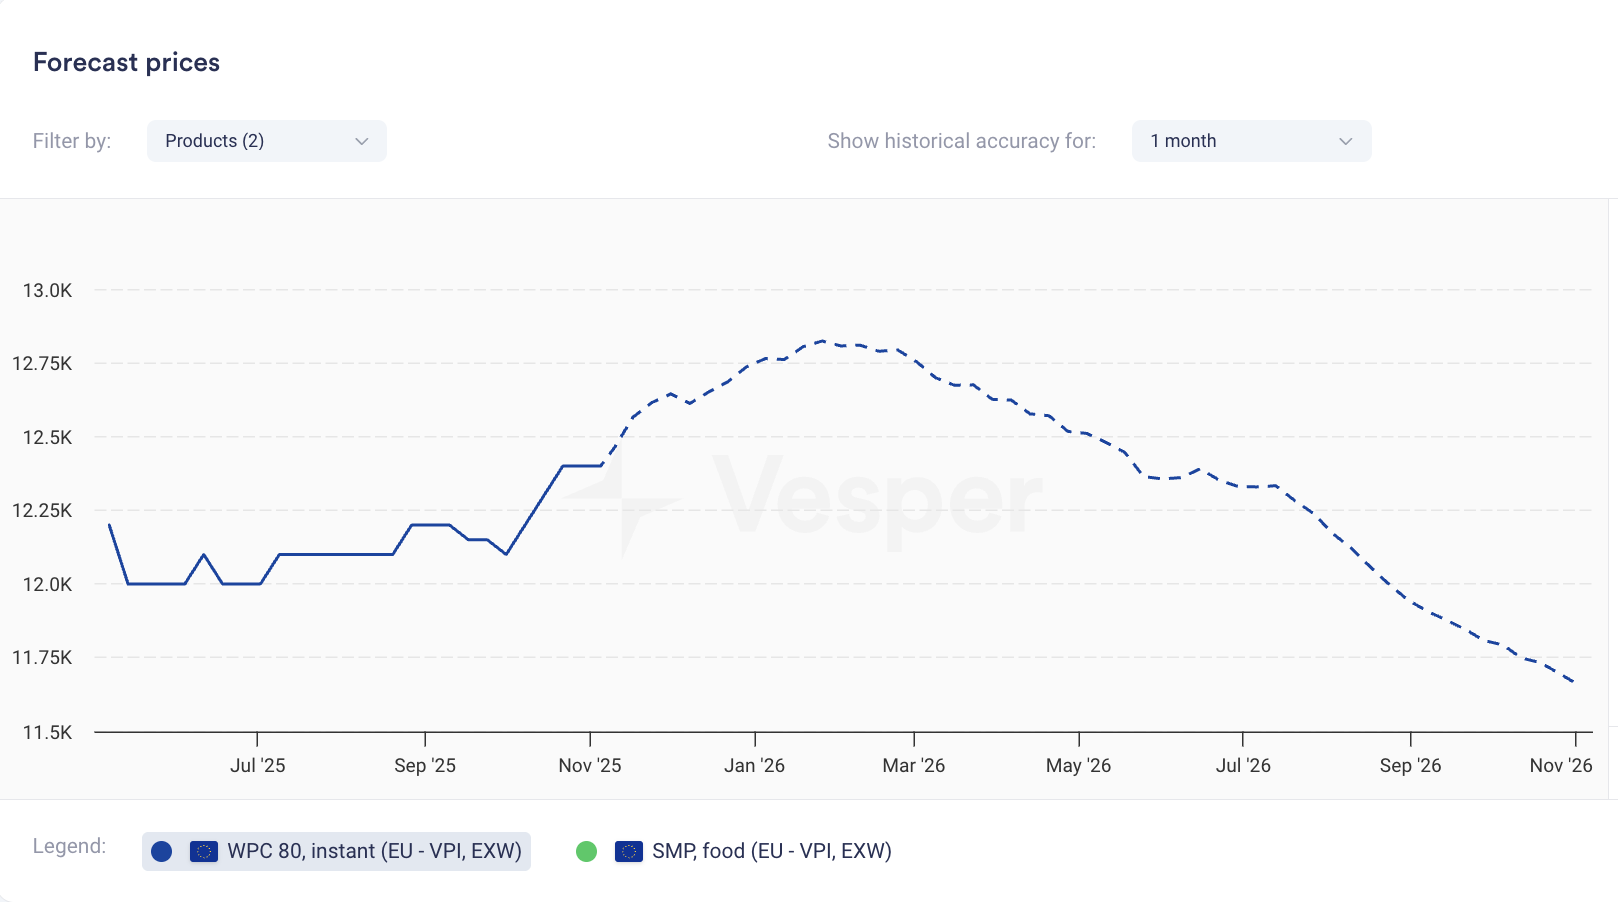
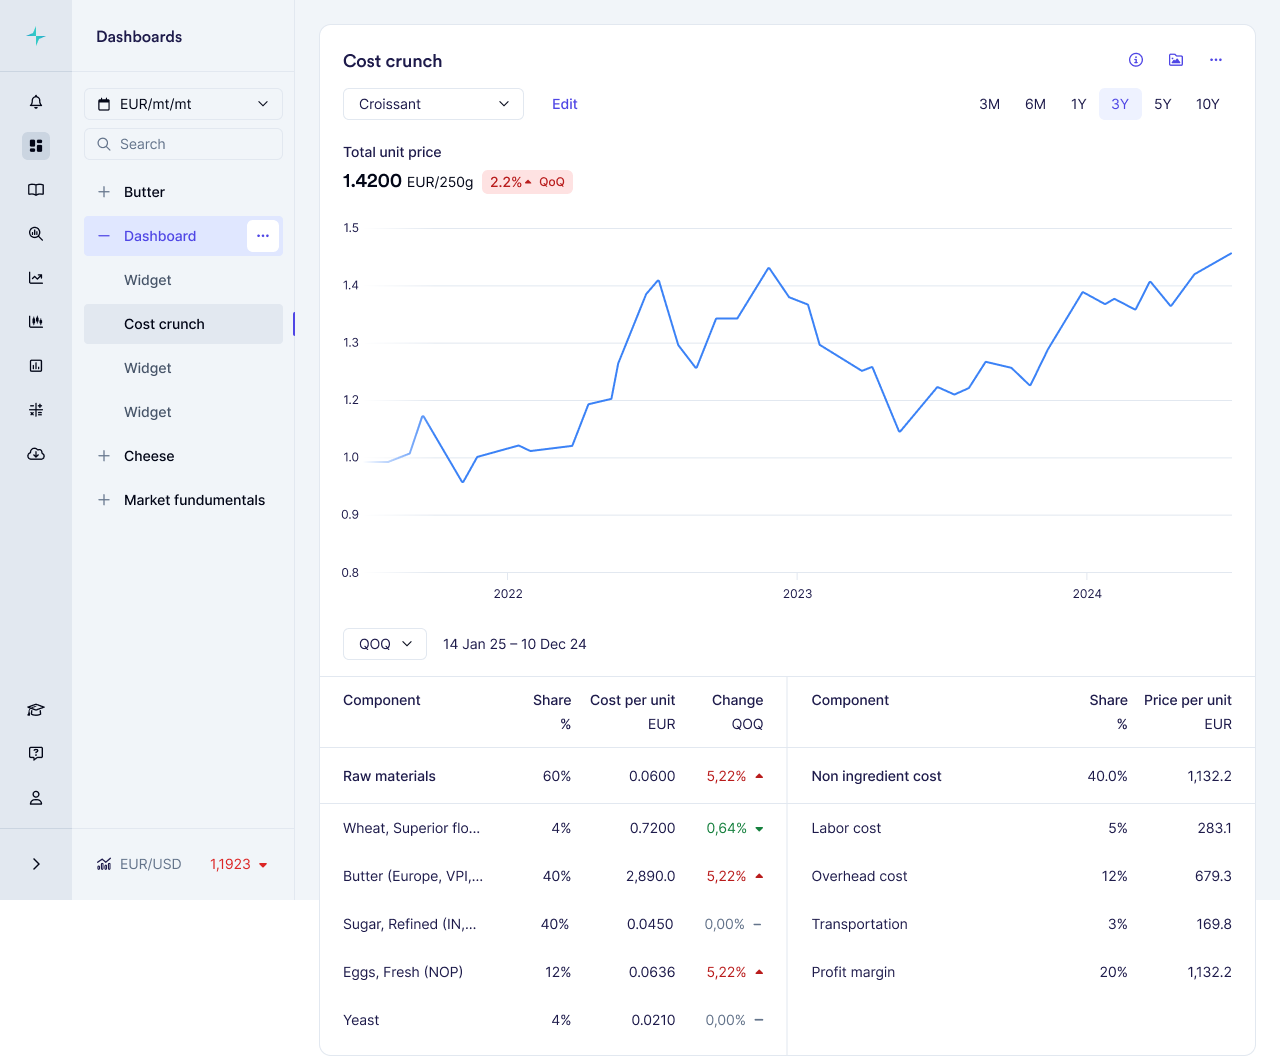
  • Cost Models: Select these Shea VPIs as ingredients in your Cost Models to forecast the total cost of confectionery, Chocolate or any other formulations using actual market data.
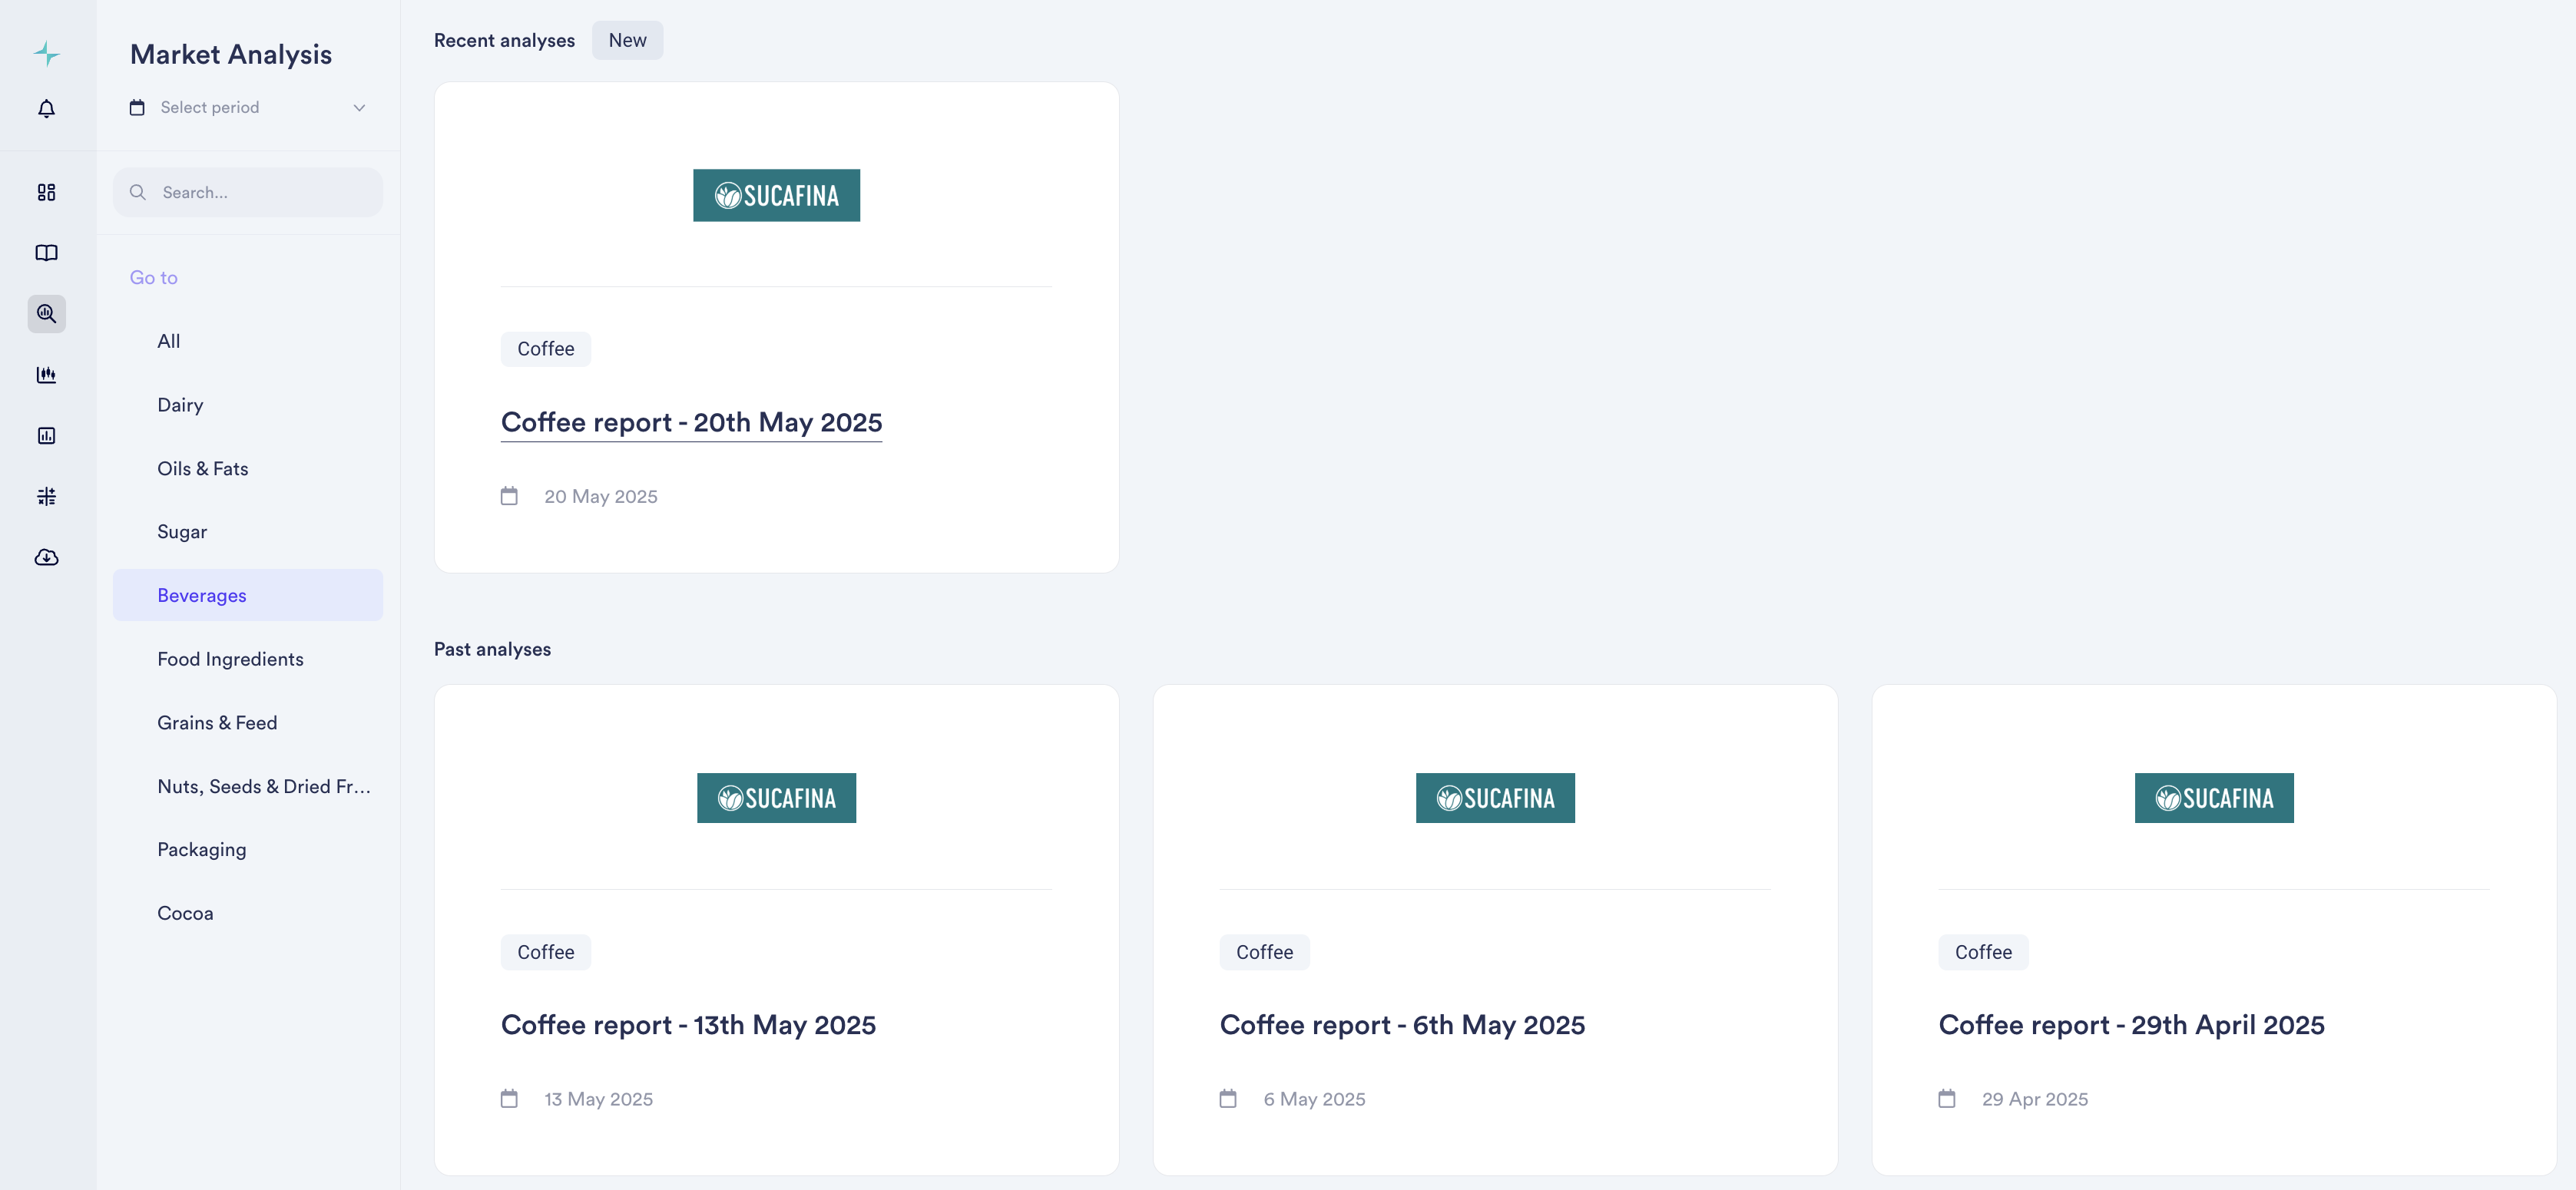
How to access?

Add to new or existing dashboards using the search function, or contact your Customer Success Manager at [email protected] to confirm which specific grades are currently active for your region.

Did you like this update?

LikeNeutralDislike

New Vesper Price Index: WPC80 Regular (US & EU)

by Vesper Team, Product Marketing
New
Vesper Price Index (VPI)
Specialized Nutrition
Sports Nutrition
Dairy

Vesper has expanded its proprietary specialty dairy protein coverage with two new Vesper Price Index (VPI) benchmarks: WPC80 Regular US and WPC80 Regular EU. Published every Wednesday, these benchmarks provide independent, region-specific price visibility, allowing procurement teams to track actual market spreads rather than relying on fixed premium assumptions or generic proxies.

What's New:

  • Weekly Regional Benchmarks: Prices for WPC80 Regular in the US and EU, published every Wednesday.

  • Verified Market Input: Prices derived from verified active market participants—both buyers and sellers—so you see where trade is actually getting done.

  • Deep Specialty Coverage: Strengthens Vesper’s unique position in specialty proteins, joining our existing benchmarks for WPC80 Instant, MPCs, WPI, Caseinates, and other niche protein products.

Why It Matters:

Relying on "80 Instant" for "Regular" WPC80 can hide the actual cost. These new Vesper benchmarks provide the independent reference needed to verify quotes against actual market prices. By establishing a shared view of the market, buyers and sellers can align on price faster, ensuring fair trade and reducing the time spent negotiating over data sources.

How to Use It:

  • Prices Widget: Bookmark the US and EU prices for one-click access to the latest Wednesday publication.

  • Price Comparison: Compare the new WPC80 Regular prices to the Instant variant and use the Spread function to instantly visualize correlations, spot patterns, and track how the price gap evolves over time.

  • Cost Models: Select these new benchmarks as ingredients in your Cost Models to see product costs with WPC80 Regular as an ingredient.

How to access?

These benchmarks are live for all Vesper users with access to the Dairy module. Contact your customer success manager at [email protected] for help integrating these new indices into your dashboard.

Did you like this update?

LikeNeutralDislike

Weekly Forecasts

by Vesper Team, Product Marketing
New
Forecasting & Outlook
Improvement
AI
Data

Price forecasts now display weekly data points instead of monthly. The same 12-month coverage now gives you 52 weekly forecasts; 6-month coverage gives you 26 weekly forecasts.

What it does: Shows forecast at weekly intervals rather than monthly What you can do: Track expected price movements week-to-week and time purchases more precisely Why it matters: Spot trends between monthly intervals and answer the tactical question: commit this week or wait? Especially valuable when markets are volatile.


Pro Tip: If forecasts look flat due to scaling (multiple products or long price histories compress the view), zoom in on the graph, temporarily hide other products using the legend, or hover for exact forecasted values.

Did you like this update?

LikeNeutralDislike

Shipping and Freight Transport Prices

by Vesper Team, Product Marketing
New
Energy & Transport
Data
Partnerships

Vesper has launched Commodity Shipping Intelligence through an exclusive partnership with Upply, bringing freight rate benchmarks directly into the platform. This integration enables procurement teams to track delivered costs by combining commodity prices with real shipping rates for their specific inbound lanes—creating true landed cost visibility.

What's New:

  • Inbound Freight Benchmarks: Real shipping rates for strategic procurement routes, not generic freight indices

  • Upply Partnership Integration: Access to validated freight data from one of Europe's leading logistics intelligence providers

  • Route-Specific Pricing: Targeted lanes for commodity imports (origin ports to destination factories)

  • Multi-Modal Coverage: Ocean freight, road transport, and intermodal combinations where relevant

  • Integrated Cost Analysis: Combine commodity prices with freight to calculate true delivered costs

Why It Matters: Commodity prices at origin tell only half the story. With shipping costs representing 10-30% of delivered prices and extreme volatility in freight markets, procurement teams need visibility into both components. This integration transforms Vesper from a commodity price platform into a complete landed cost intelligence system—critical for accurate budgeting and supplier selection.

How to Use It:

  1. Search freight routes using origin-destination pairs in the platform search

  2. Add to dashboards alongside relevant commodity prices for complete cost tracking

How to access? Freight rates are available to all Vesper users who have access to the Energy and Transport category. For more information, contact [email protected].

Did you like this update?

LikeNeutralDislike

New: Deselect All Button

by Vesper Team, Product Marketing
Improvement
New
Vesper Toolbox

Clear your widget selections instantly with the new "Deselect all" button in dropdown menus. Start fresh analysis without manually removing each selection or dealing with cluttered views.

What it does: One click clears all active selections in a widget What you can do: Reset widgets to empty state for clean analysis Why it matters: Faster workflow, cleaner screens, less clicking

Find it in the dropdown menus across most widgets.

Did you like this update?

LikeNeutralDislike

Technical Analysis: Interpretable and actionable for all food commodity products

by Vesper Team
New
Vesper Toolbox
Forecasting & Outlook

Summary: Vesper has launched Technical Analysis, a new forward-looking capability that translates complex market behavior into clear, actionable timing signals. Previously reserved for trading experts using specialized tools, technical analysis is now accessible to every procurement professional through simple, visual indicators. This feature helps teams identify optimal buying windows by analyzing price patterns and momentum, delivering straightforward signals that answer the critical question: "When should I act?"—no financial expertise required.

What's New:

  • Three procurement-focused indicators that signal market timing without financial jargon

  • Moving Averages show if prices are trending above or below "normal" levels

  • MACD detects when price movements are accelerating or losing steam

  • RSI identifies when markets are overheated or oversold, highlighting potential reversals

  • Clean visual signals (green/red arrows + Interpreted text) that make complex analysis instantly understandable

Why It Matters: Fundamental data tells you why prices should move, but not when the market will react. Technical Analysis bridges this gap by revealing when markets start believing the fundamental story. In volatile markets where timing can mean the difference between saving and losing on purchases in volatile markets. These indicators help procurement teams spot early trend changes, identify optimal entry points, and avoid buying at market extremes, without requiring trading expertise.

How to Use It:

  1. Add Technical Analysis to any dashboard by using the search function

  2. View the summary panel showing all three indicators at a glance

  3. Green arrows indicate upward pressure/momentum, red indicates downward

  4. Click the extended view for in depth analysis of the indicators

  5. Combine with Vesper's other forward-looking tools for complete forward looking intelligence

Related Features: Technical Analysis completes Vesper's forward-looking toolkit:

  • AI Forecasting predicts where prices are headed (the "how much")

  • Dashboard fundamentals explain market drivers (the "why")

  • Market reports provide expert context

  • Now Technical Analysis reveals entry point (the "when")

Did you like this update?

LikeNeutralDislike

300 new Beef, Pork, and Lamb Prices

by Vesper Team
New
Data
Food Manufacturing
Meat & Poultry

What's New

  • 300 new daily price series covering major beef, pork, and lamb products

  • Real-time daily updates to ensure you have the latest market data

  • Coverage across different cuts, grades, and products

How to use in Vesper:
Prices Widget

  • Easily track and monitor daily price movements for all meat categories

  • Quick access to historical trends and current market conditions

  • Ideal widget for efficient price monitoring

Cost Models

  • Incorporate new meat price data into custom recipe breakdowns

  • Build cost models that reflect your product’s market pricing

  • Create detailed analyses for food service, retail, and manufacturing applications

Price Comparison

  • Compare meat prices against other commodity products

  • Identify correlations and patterns between different protein markets

Getting Started

The new meat price series are immediately to users with Meats&Poultry in their commodity package. To begin using this data:

  1. Use the Prices Widget to explore individual price series

  2. Use the Price Comparison to analyze relationships between meat and other commodities

  3. Access Cost Models to incorporate the new data into your custom analyses

Questions or Support

For questions about the new meat price series or assistance with implementation, please contact our support team at: [email protected]

Did you like this update?

LikeNeutralDislike

New Weekly Market Analysis: Coffee Report

by Vesper Team
New
Beverages
Market Analysis

Summary: Vesper is excited to announce the launch of a new weekly market analysis report focused exclusively on coffee. This report, authored by industry leader Sucafina, will provide in-depth insights and timely updates on the global coffee market.

What's New:

  • Dedicated Coffee Market Analysis: A specialized weekly report offering expert analysis of the coffee market.

  • Expert Author: Authored by Sucafina, the leading sustainable Farm to Roaster coffee company with a rich history in commodities since 1905.

  • Frequency: Delivered weekly to keep you informed of the latest market movements.

  • Release Schedule: Available every Tuesday afternoon.

Why It Matters:

Coffee is a critical commodity for many of our users, and this new dedicated report will provide invaluable, focused intelligence. By partnering with Sucafina, we're bringing you expert perspectives and analysis to help you:

  • Understand current market dynamics and trends.

  • Anticipate potential shifts in supply, demand, and pricing.

  • Make more informed purchasing and trading decisions.

  • Gain a deeper understanding of the factors influencing the coffee industry, from farm to roaster.

How to Use It:

  • Access the new Coffee Market Analysis report in the Market Analysis section of the Vesper platform.

  • Look for the report updates every Tuesday afternoon.

  • Consider setting up alerts to be notified when the new report is published.

Read the latest report

Did you like this update?

LikeNeutralDislike

Cost Models: Turn commodity benchmarks into product pricing

by Vesper Team
New
Food Manufacturing
Retail
Cost Models

Summary: Vesper has launched Cost Models, a powerful new feature that transforms individual commodity benchmarks into complete product cost insights. This capability allows food manufacturers to combine weighted commodity benchmarks with standardized non-ingredient costs to build accurate product pricing models, delivering unprecedented visibility into true product economics.

What's New:

  • Build complete product cost models by combining multiple commodity benchmarks with precise weightings

  • Access industry-standard non-ingredient costs (labor, manufacturing, overhead) specific to your region

  • Choose from our template library for common food products or create custom models

  • Track how each component contributes to your total product cost with automatic updates whenever source prices change

Why It Matters: With record-high volatility across food commodities, understanding how ingredient changes impact finished products is critical for maintaining margins. Cost Models provide complete cost structure visibility for your entire organization: procurement teams can verify supplier price increases, finance can track margin impacts across product portfolios, and sales teams can justify price adjustments to customers with independently verified data. Non-ingredient costs can represent up to 47% of total product costs—a critical component that's now visible alongside your commodity benchmarks.

How to Use It:

  1. Access Cost Models through the main dashboard menu

  2. Choose between starting with a template or building a model from scratch

  3. Select ingredients from your available commodities and assign precise weightings

  4. Add country-specific non-ingredient costs by selecting your industry and location

  5. Save your model to track cost evolution over time as prices update automatically

Related Features: Cost Models integrates seamlessly with Vesper's existing capabilities:

  • Individual commodity price benchmarks (VPI, Partner prices, and Public benchmarks found in prices widgets)

  • Incorporate into your own custom dashboards

  • Coming in Q3 2025: Forecasting capabilities for your cost models

Did you like this update?

LikeNeutralDislike