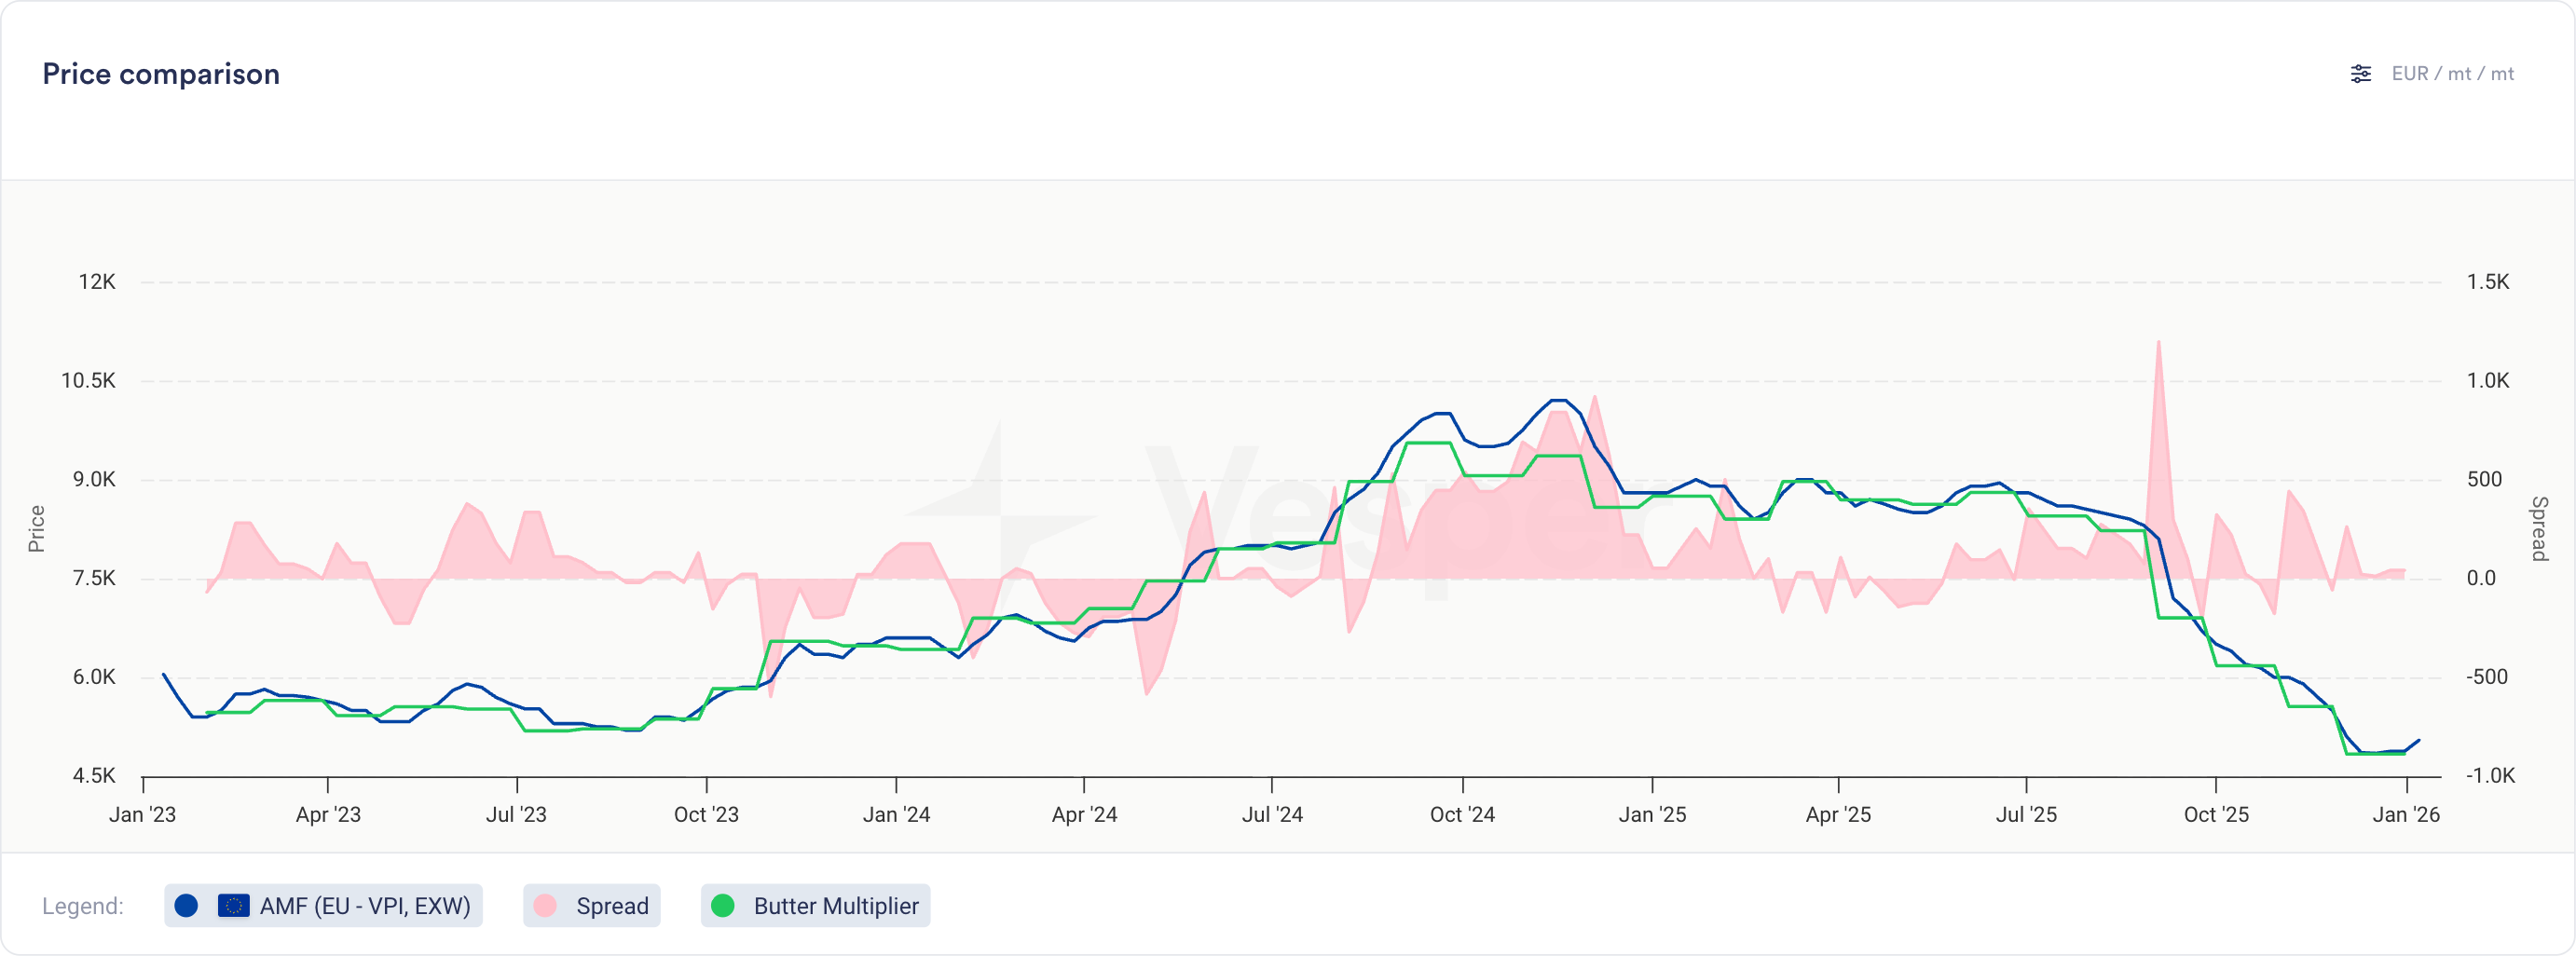
You can now compare your cost models directly against actual prices and other cost models in the Price Comparison widget.
What's new
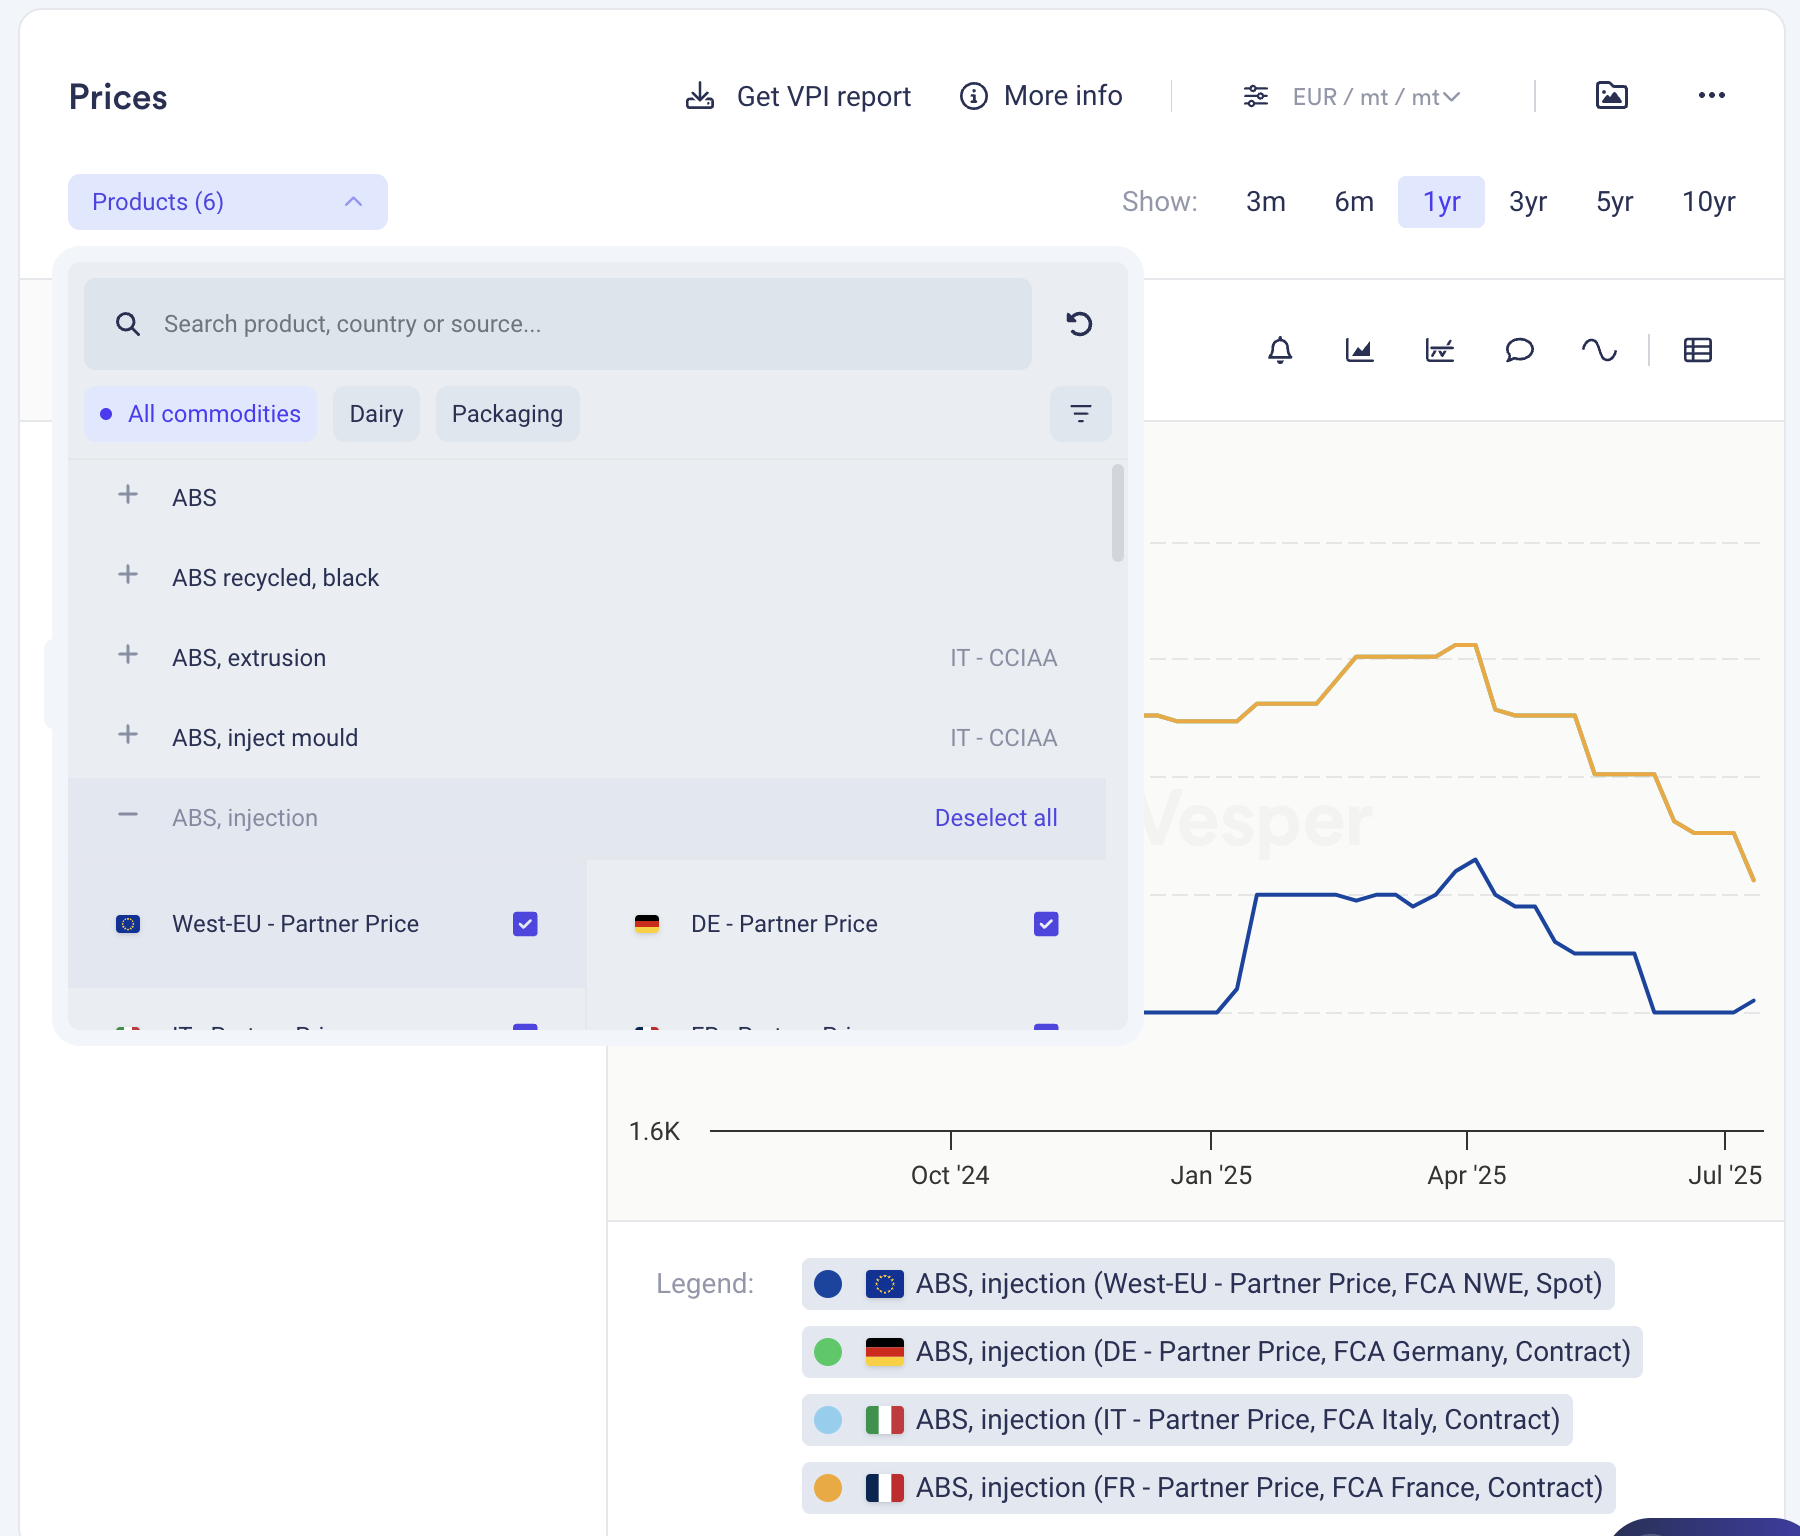
Cost models now appear as selectable series in the Price Comparison widget
Select cost models from the product dropdown, labeled with their cost model name
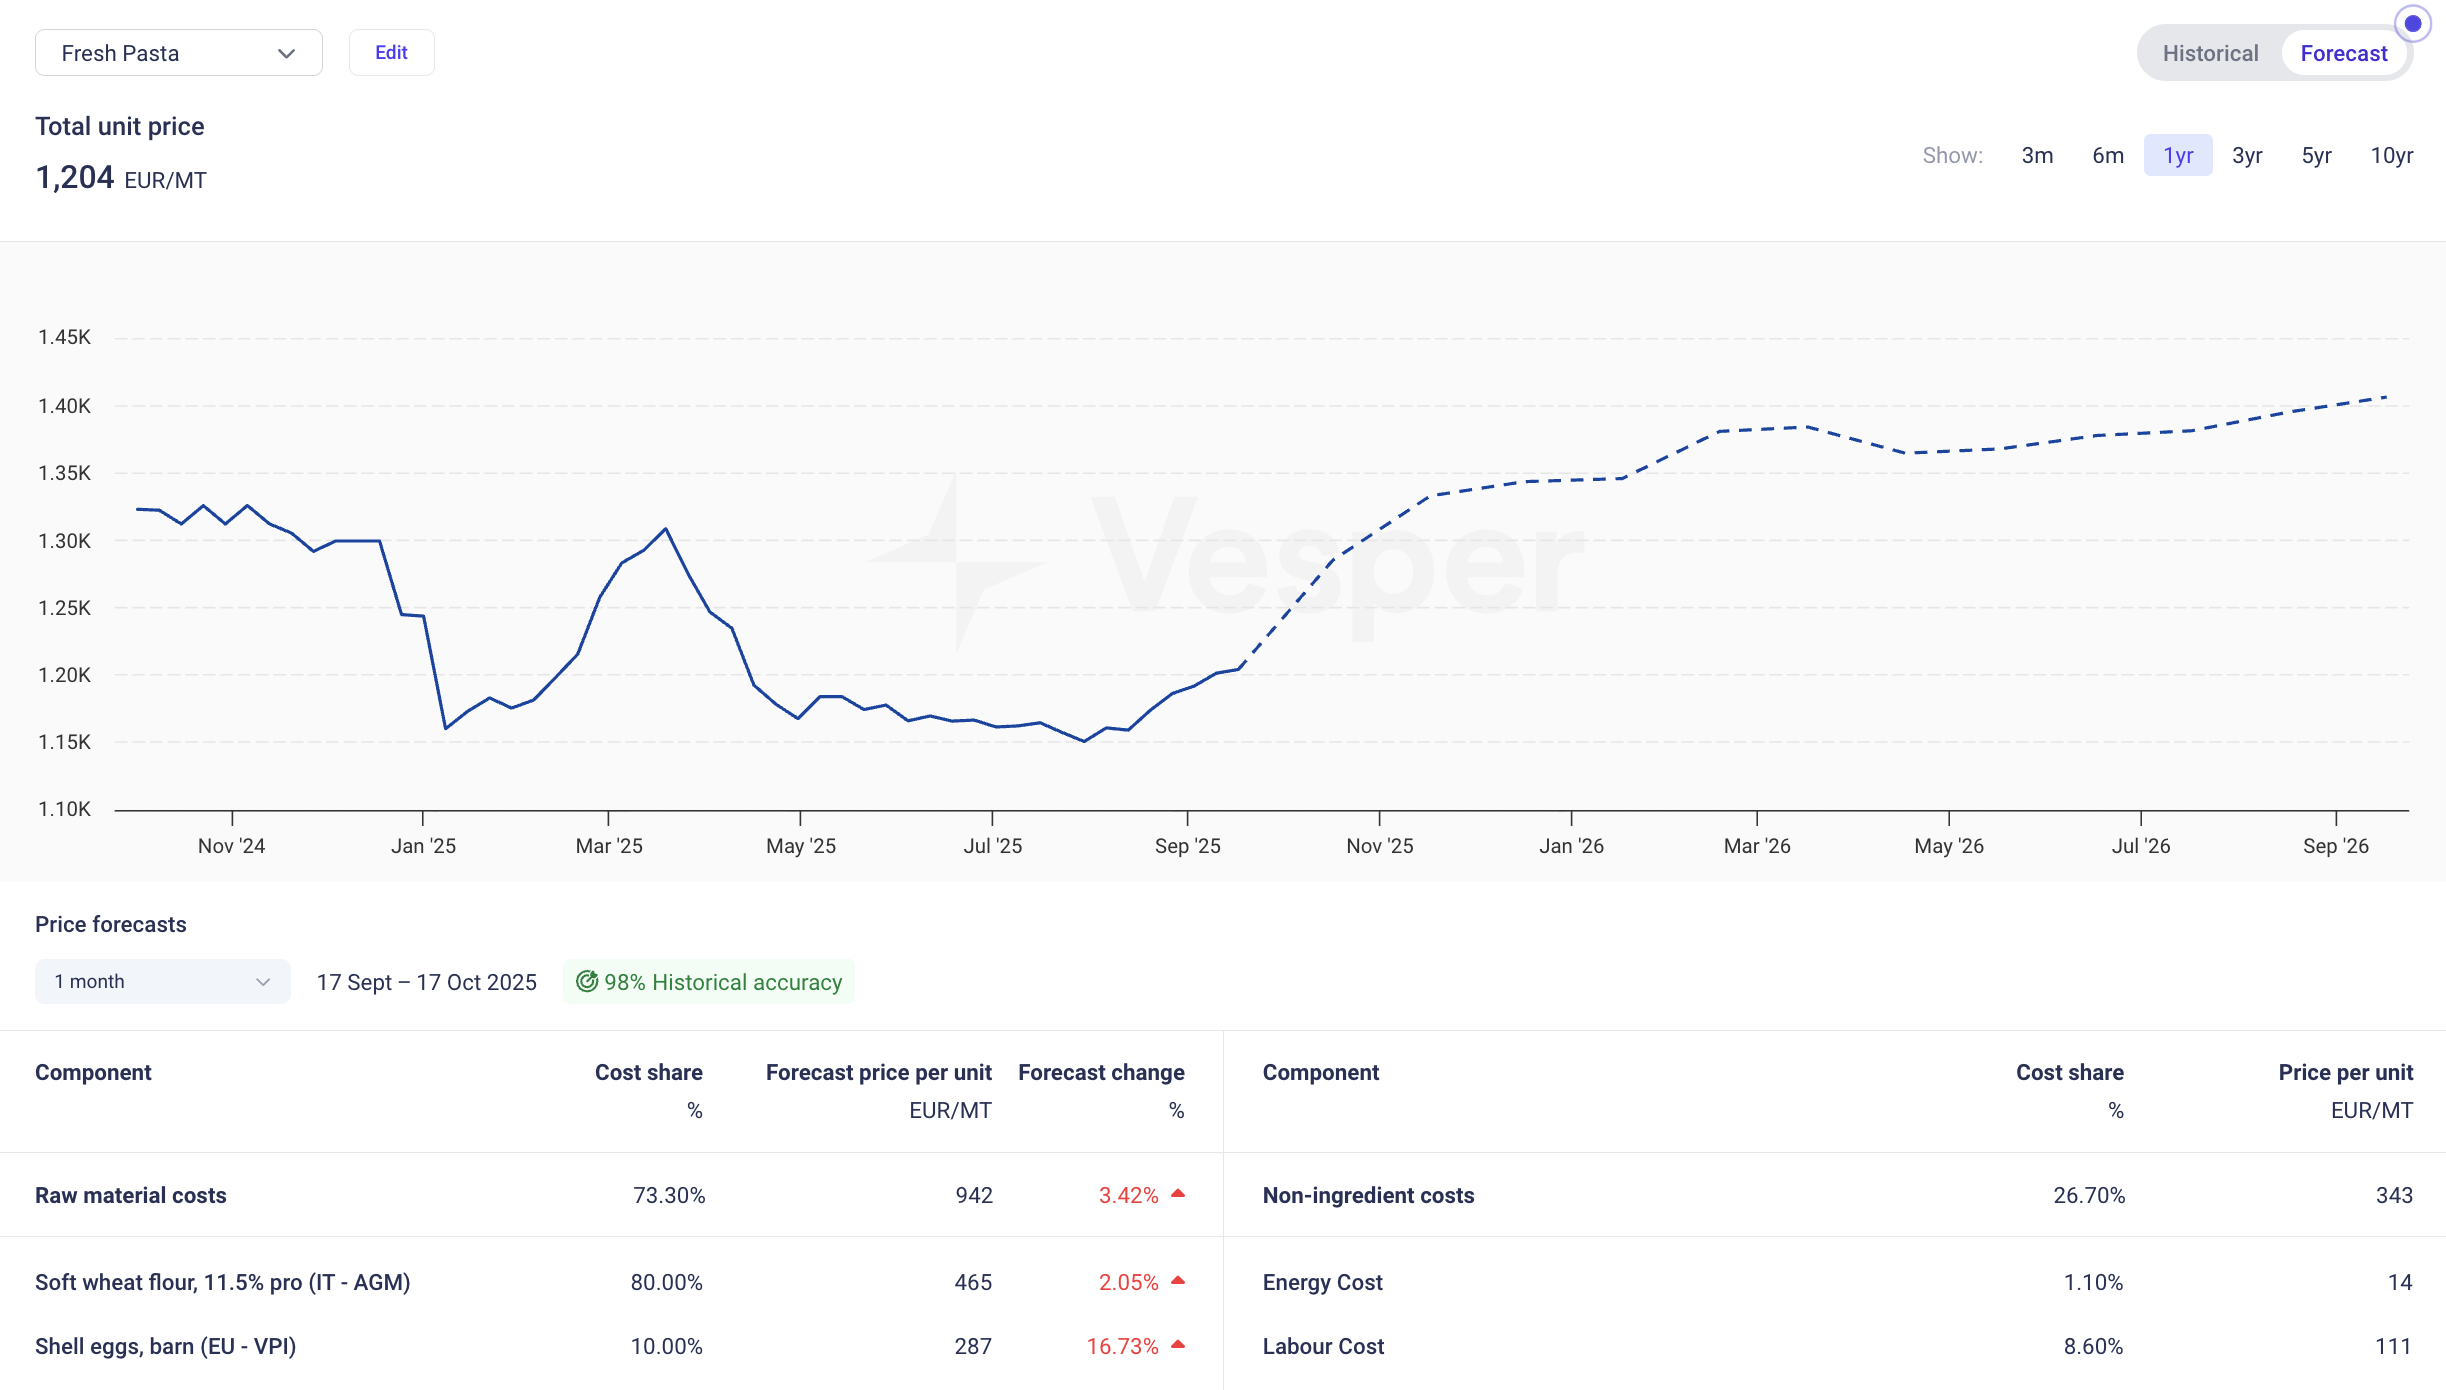
View cost model historical data alongside multiple other cost models, price series, or any combination of both
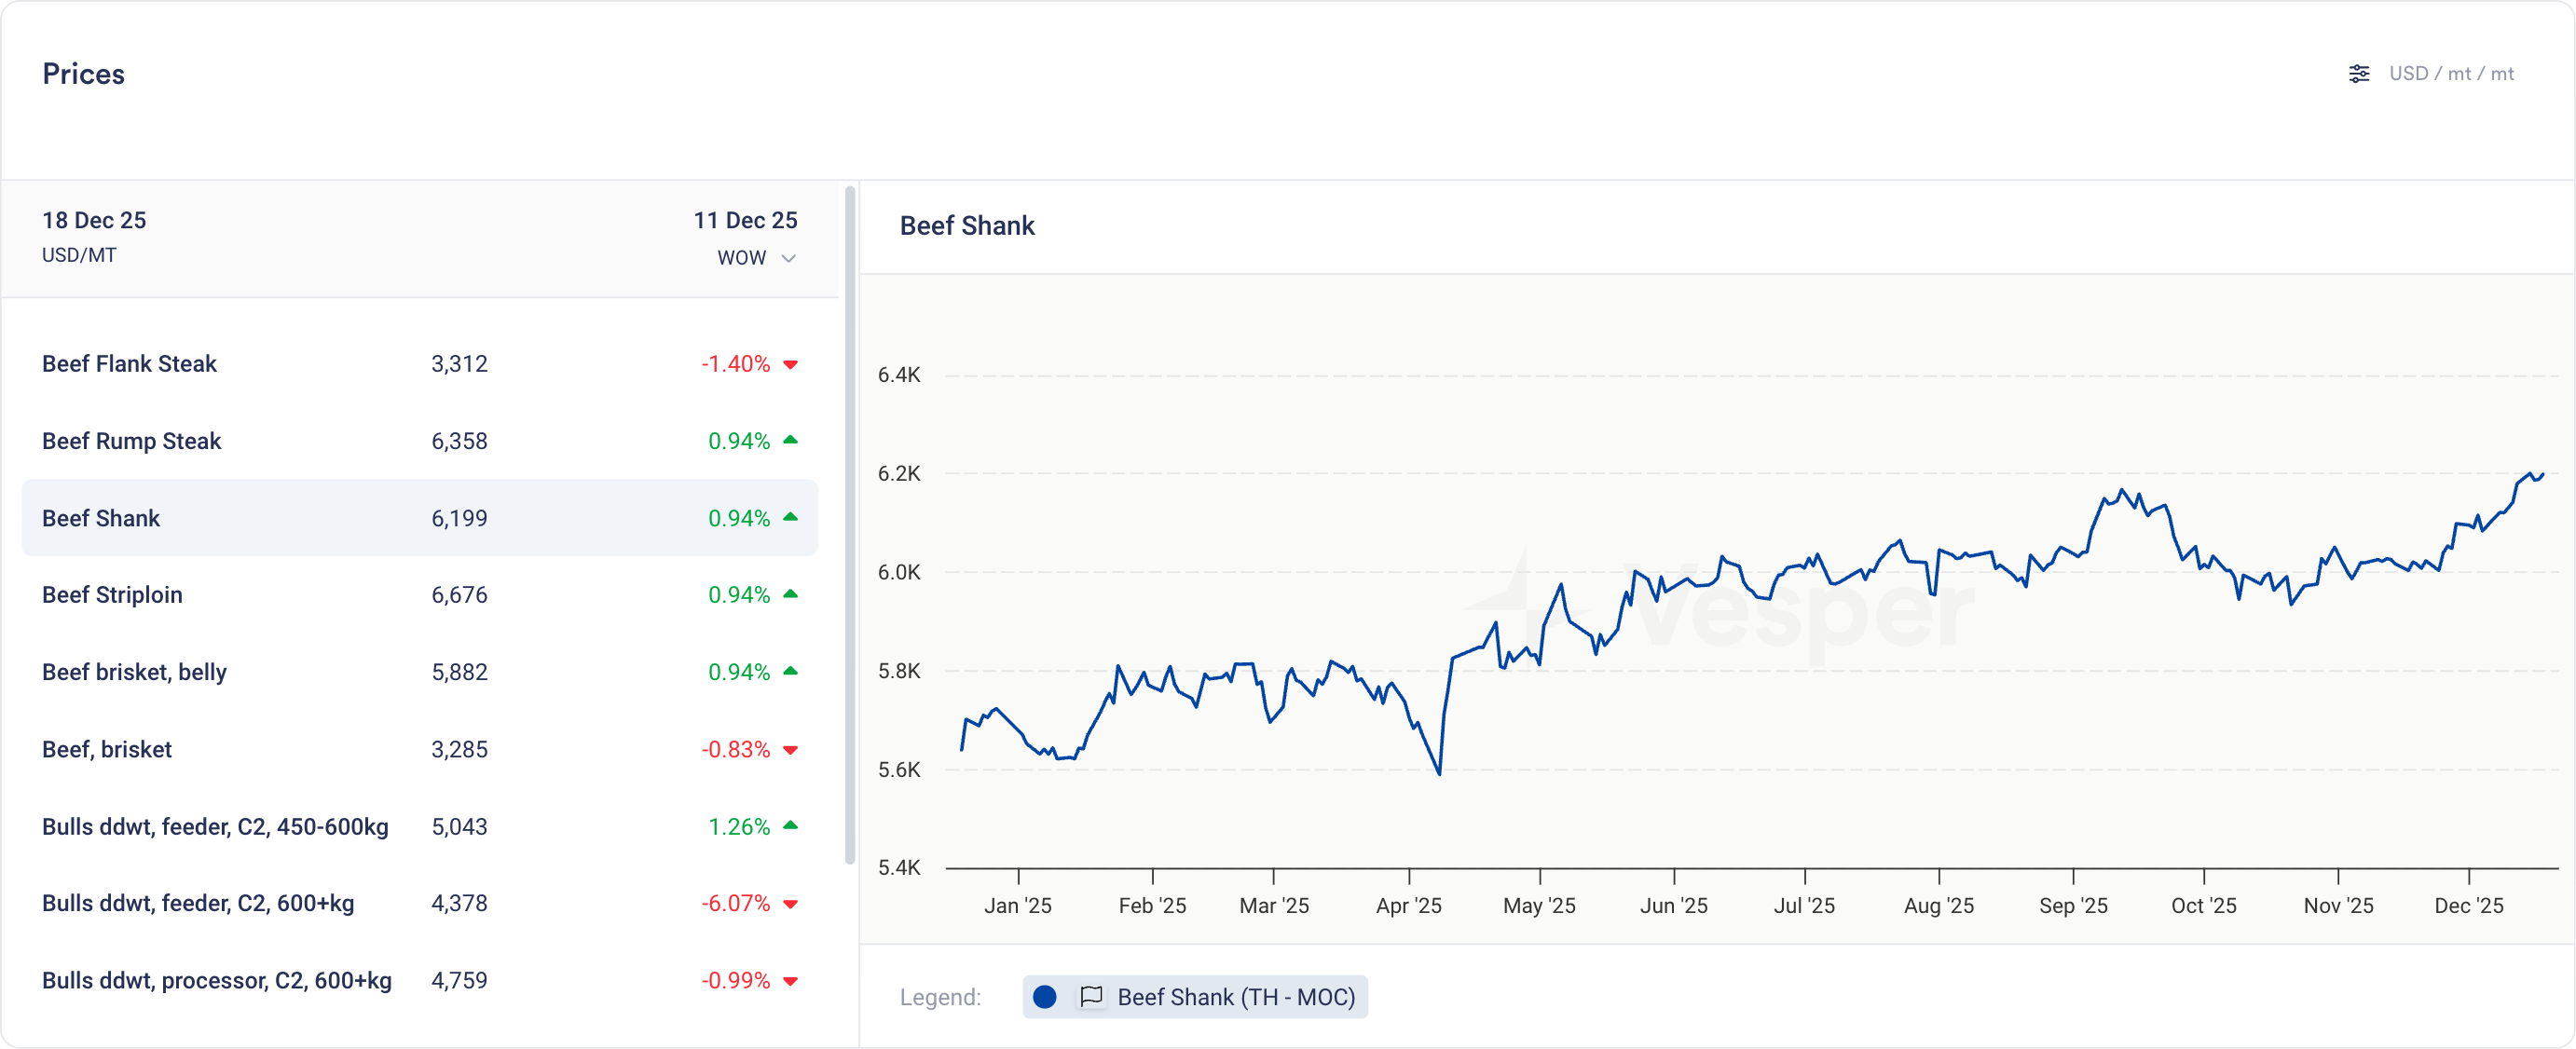
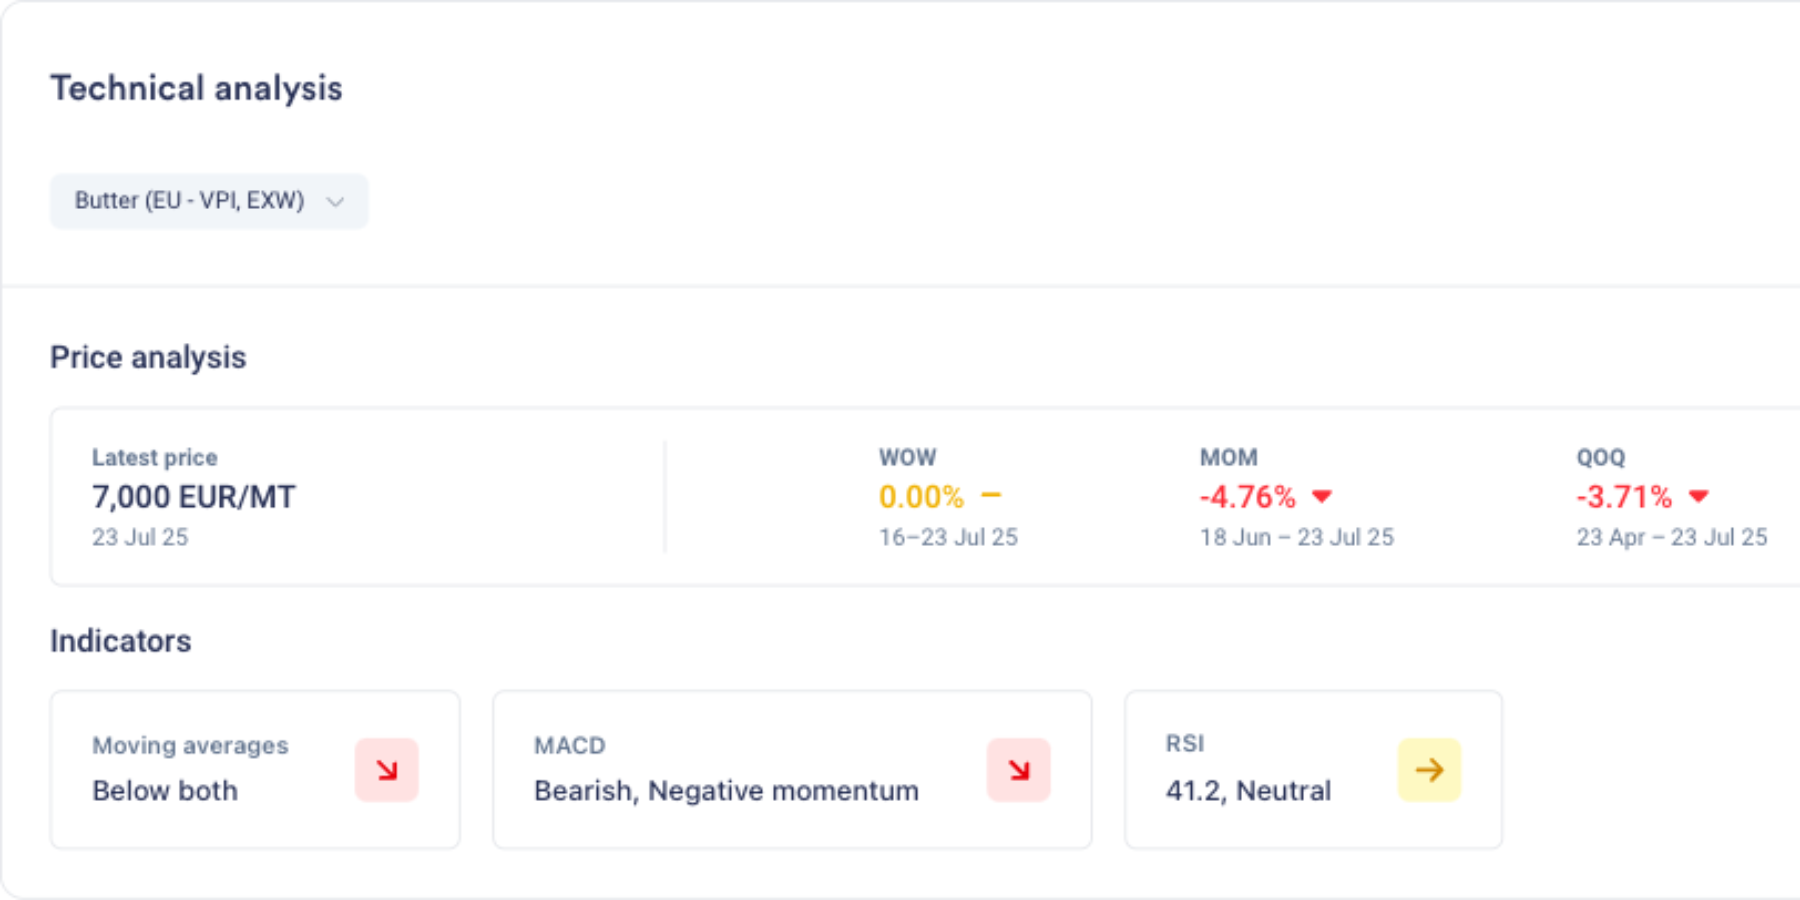
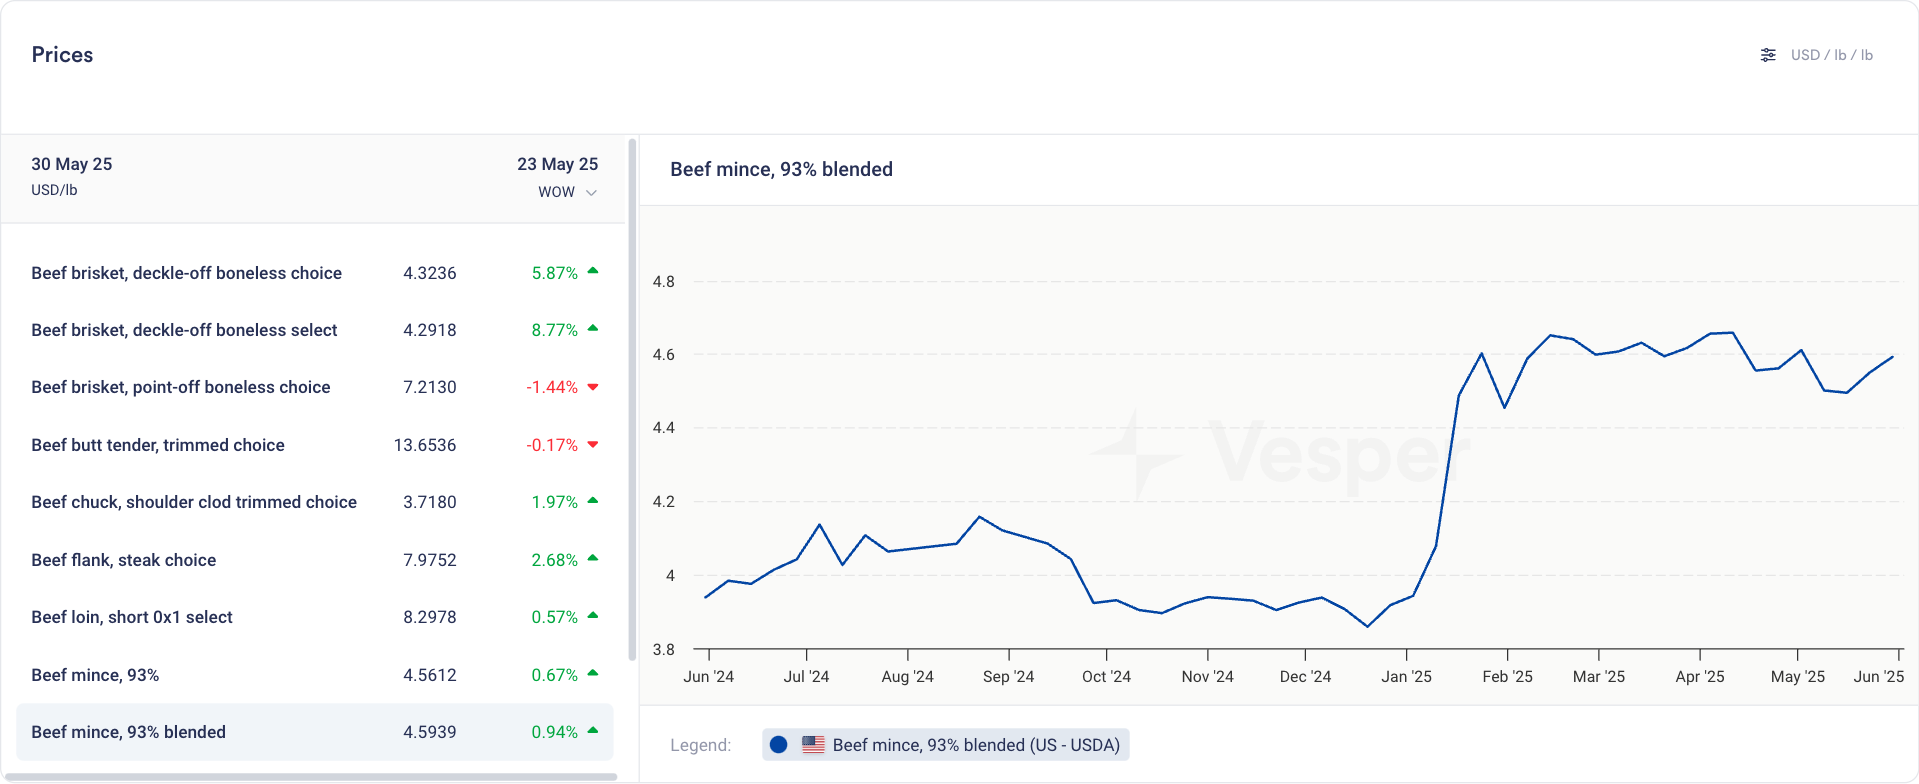
Same visualization and interaction as product prices (line charts, tooltips, trends)
Note: Notes cannot be added to cost models
Why this matters
For finished goods, this bridges cost modeling and price analysis:
Compare different recipe options to find the most cost-effective formulation
Validate actual paid prices against theoretical cost models to spot inefficiencies
Track variance trends over time to identify negotiation opportunities
For commodity and ingredient buyers, this opens up new ways to analyze contract structures:
Build indices for weighted baskets and compare against other indices or your own prices
Model multiplier or fixed cost-plus structures on top of any benchmark