Vesper has expanded its proprietary specialty dairy protein coverage with two new Vesper Price Index (VPI) benchmarks: WPC80 Regular US and WPC80 Regular EU. Published every Wednesday, these benchmarks provide independent, region-specific price visibility, allowing procurement teams to track actual market spreads rather than relying on fixed premium assumptions or generic proxies.
What's New:
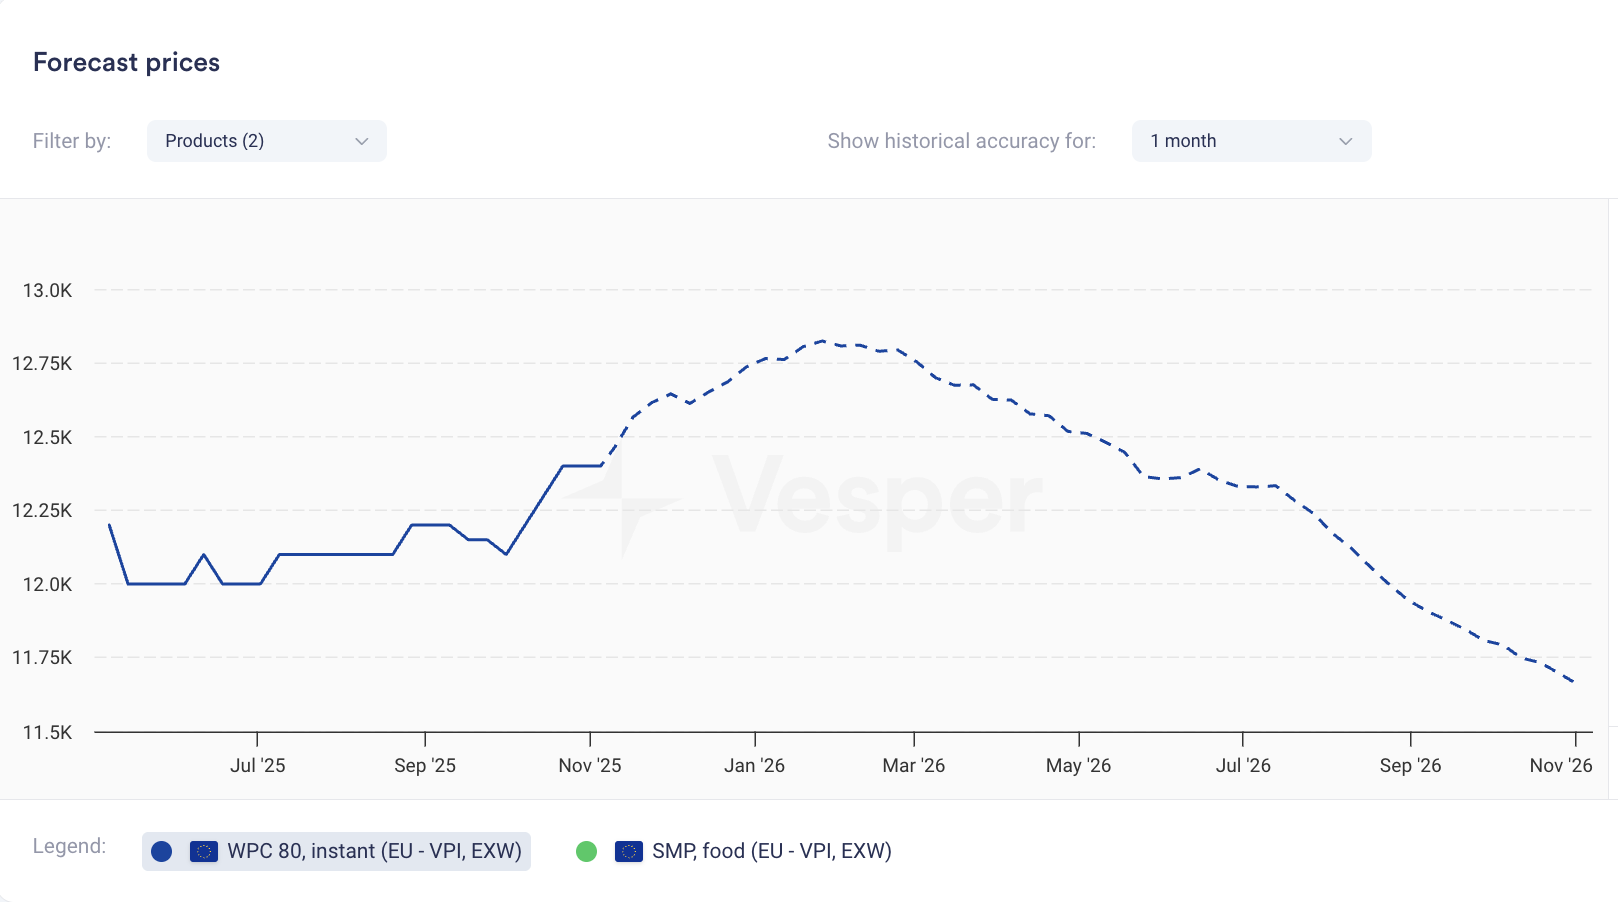
Weekly Regional Benchmarks: Prices for WPC80 Regular in the US and EU, published every Wednesday.
Verified Market Input: Prices derived from verified active market participants—both buyers and sellers—so you see where trade is actually getting done.
Deep Specialty Coverage: Strengthens Vesper’s unique position in specialty proteins, joining our existing benchmarks for WPC80 Instant, MPCs, WPI, Caseinates, and other niche protein products.
Why It Matters:
Relying on "80 Instant" for "Regular" WPC80 can hide the actual cost. These new Vesper benchmarks provide the independent reference needed to verify quotes against actual market prices. By establishing a shared view of the market, buyers and sellers can align on price faster, ensuring fair trade and reducing the time spent negotiating over data sources.
How to Use It:
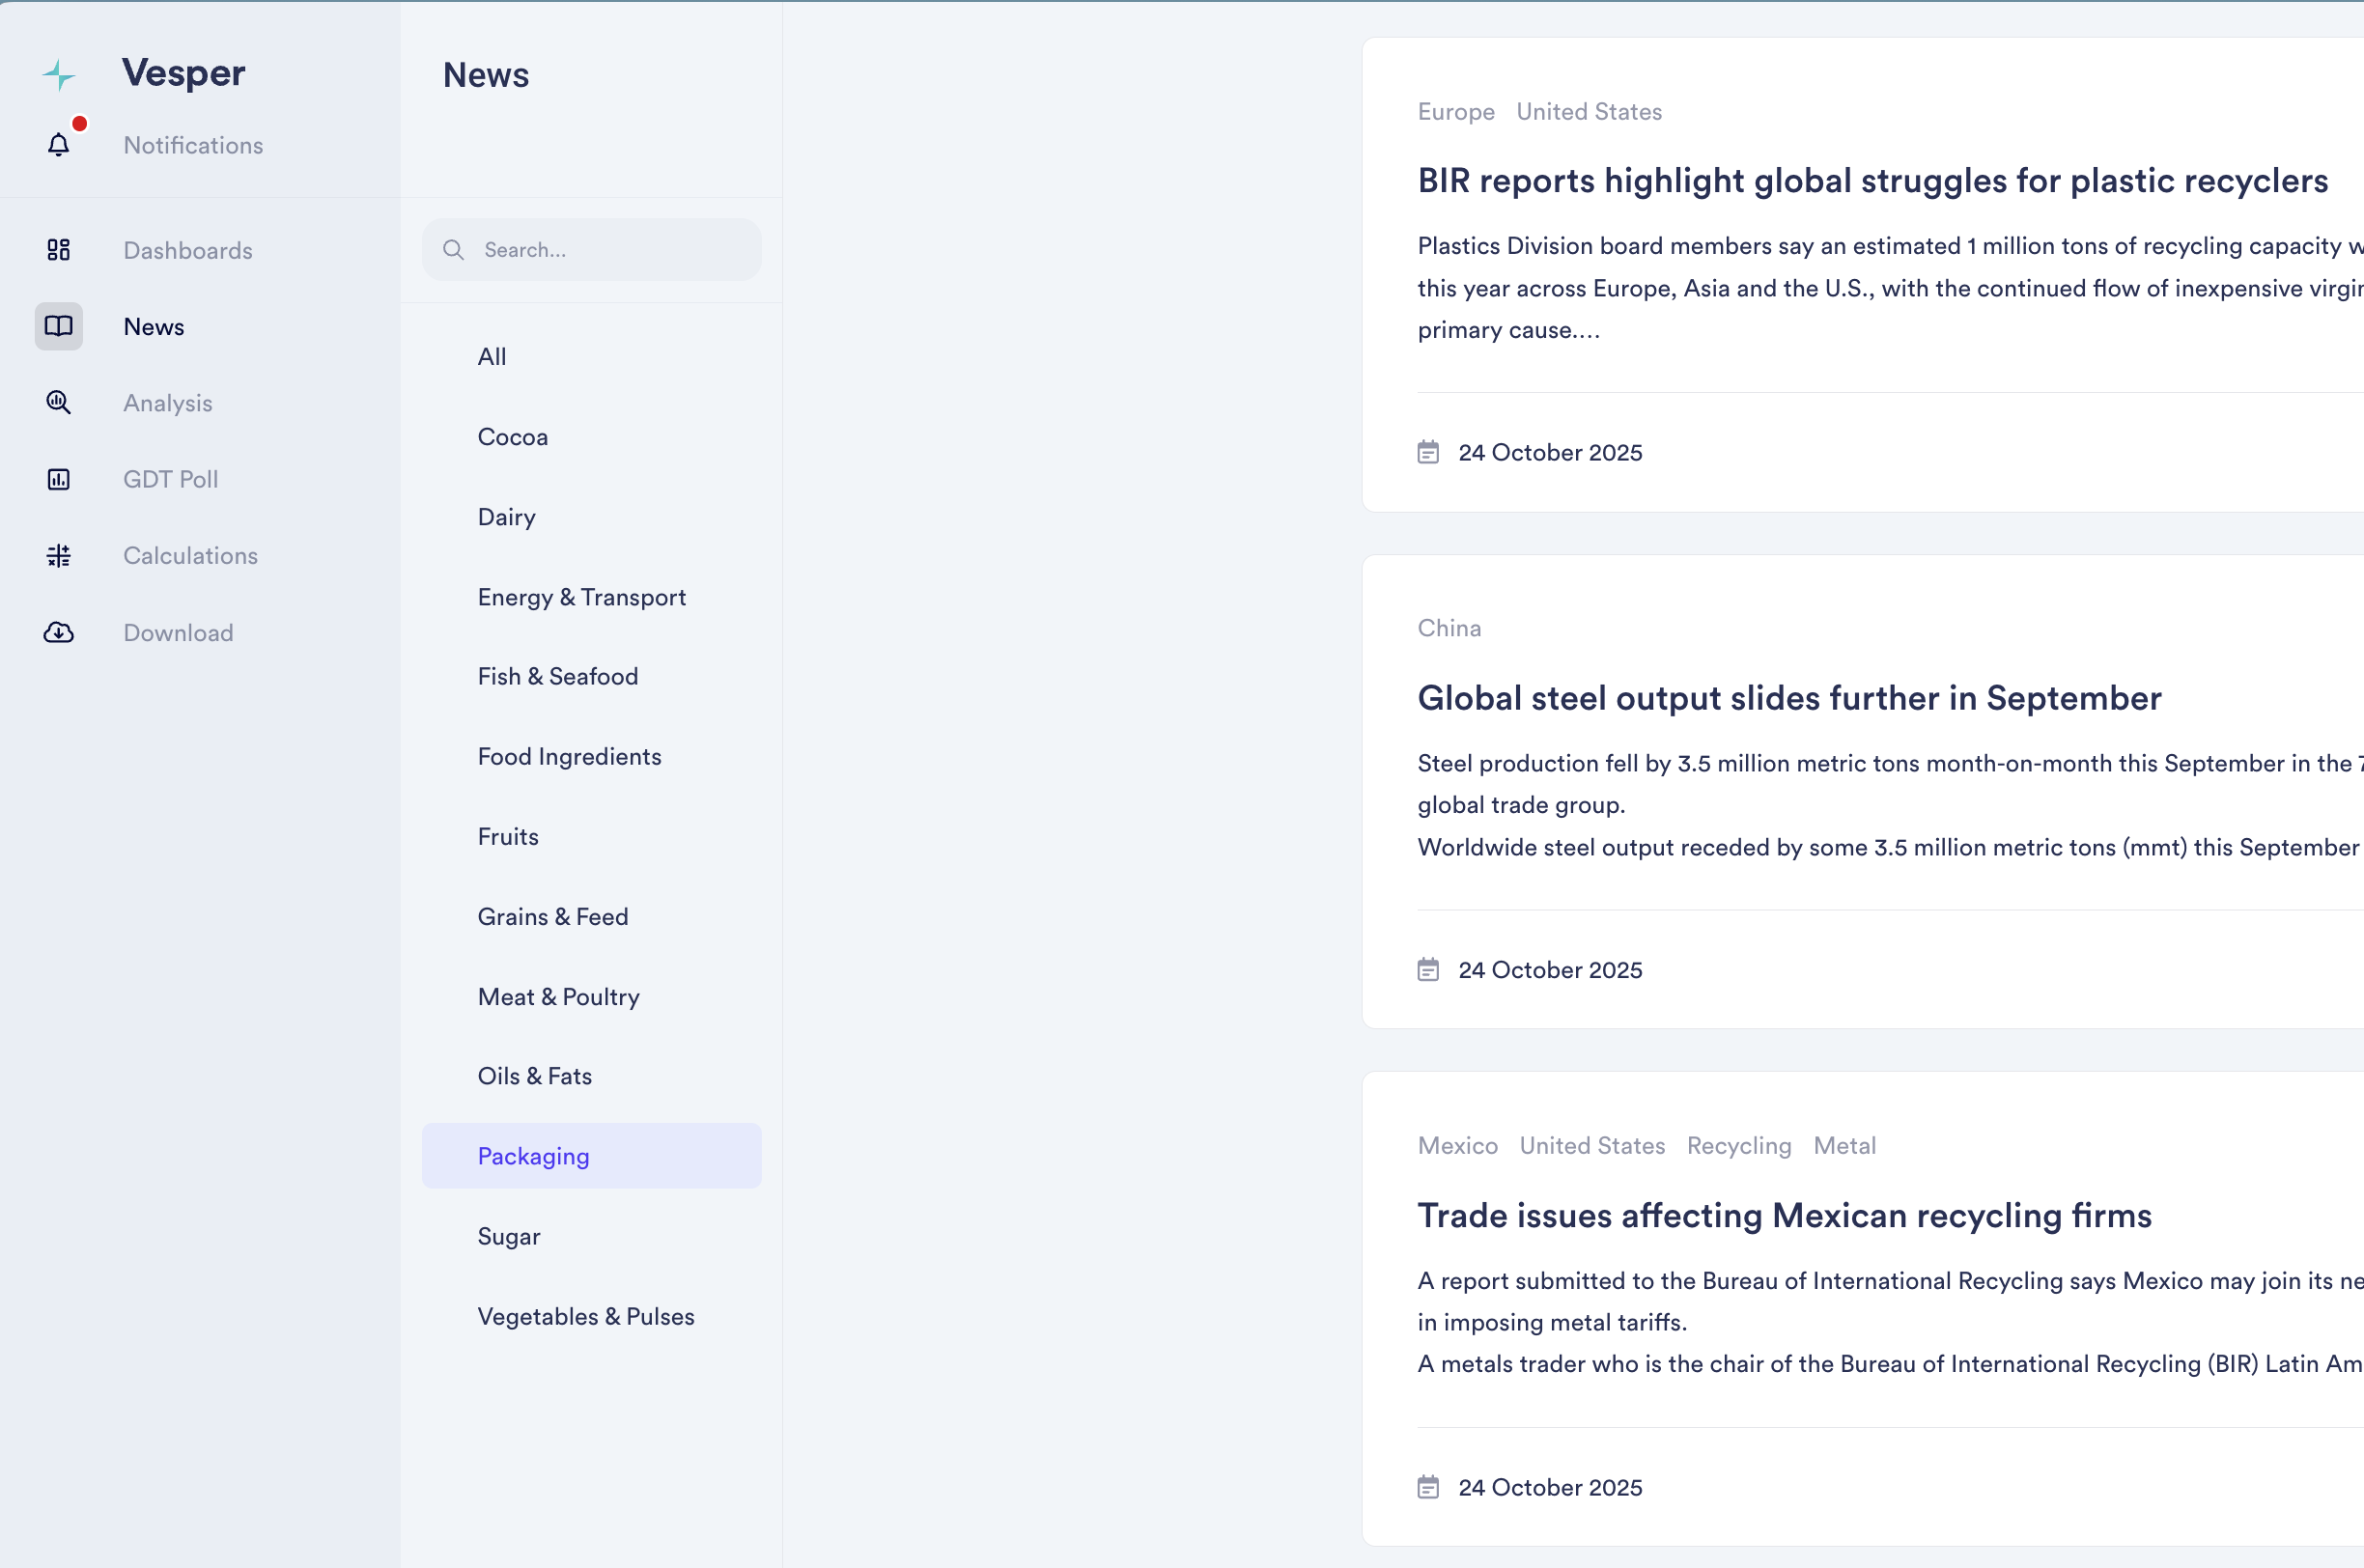
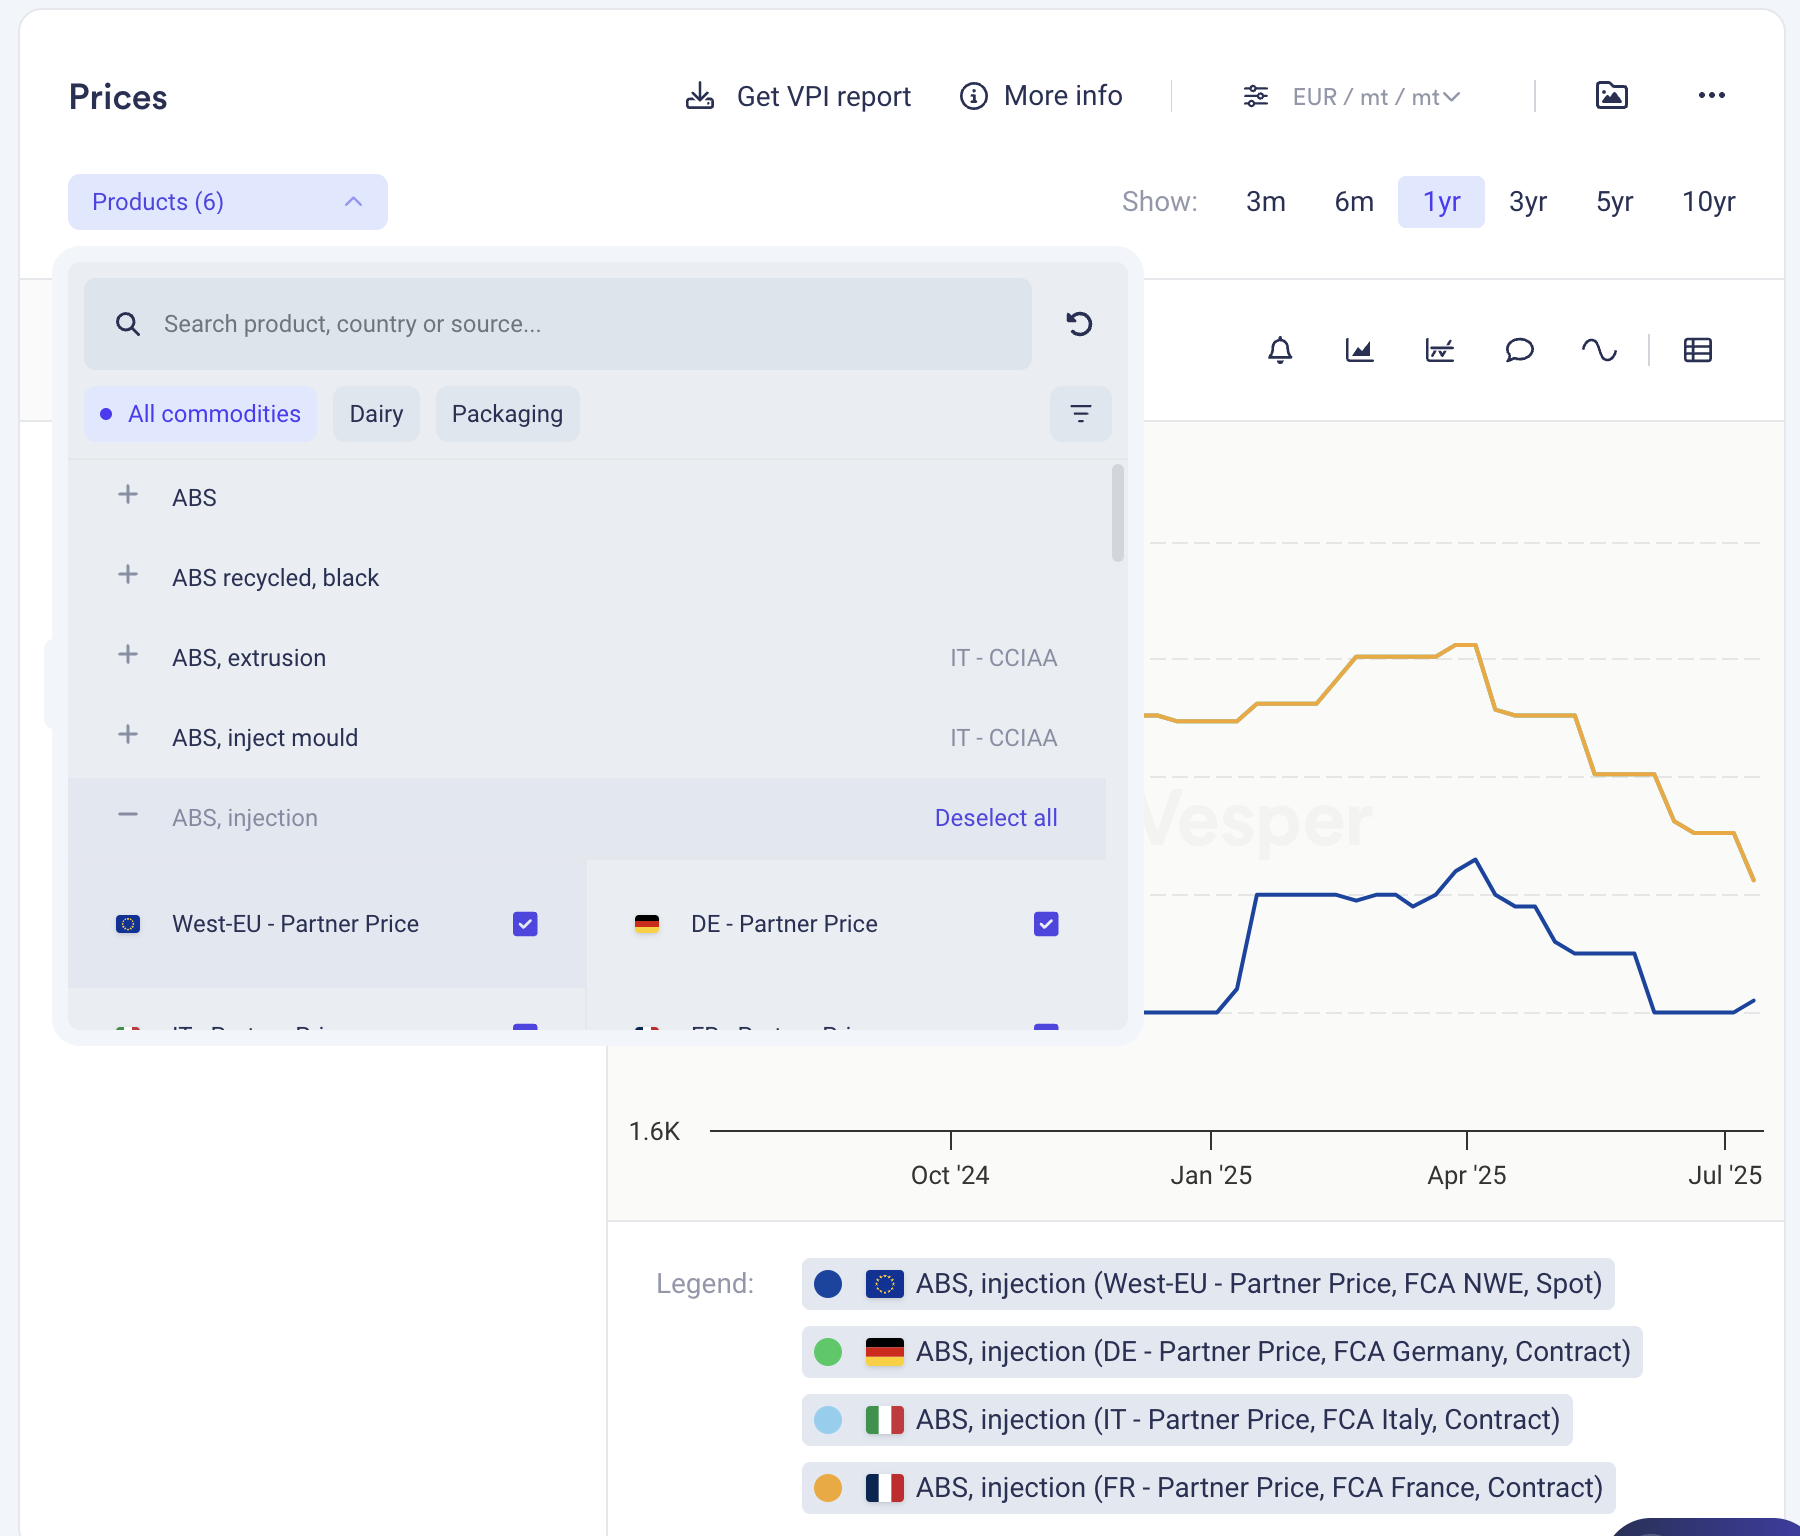
Prices Widget: Bookmark the US and EU prices for one-click access to the latest Wednesday publication.
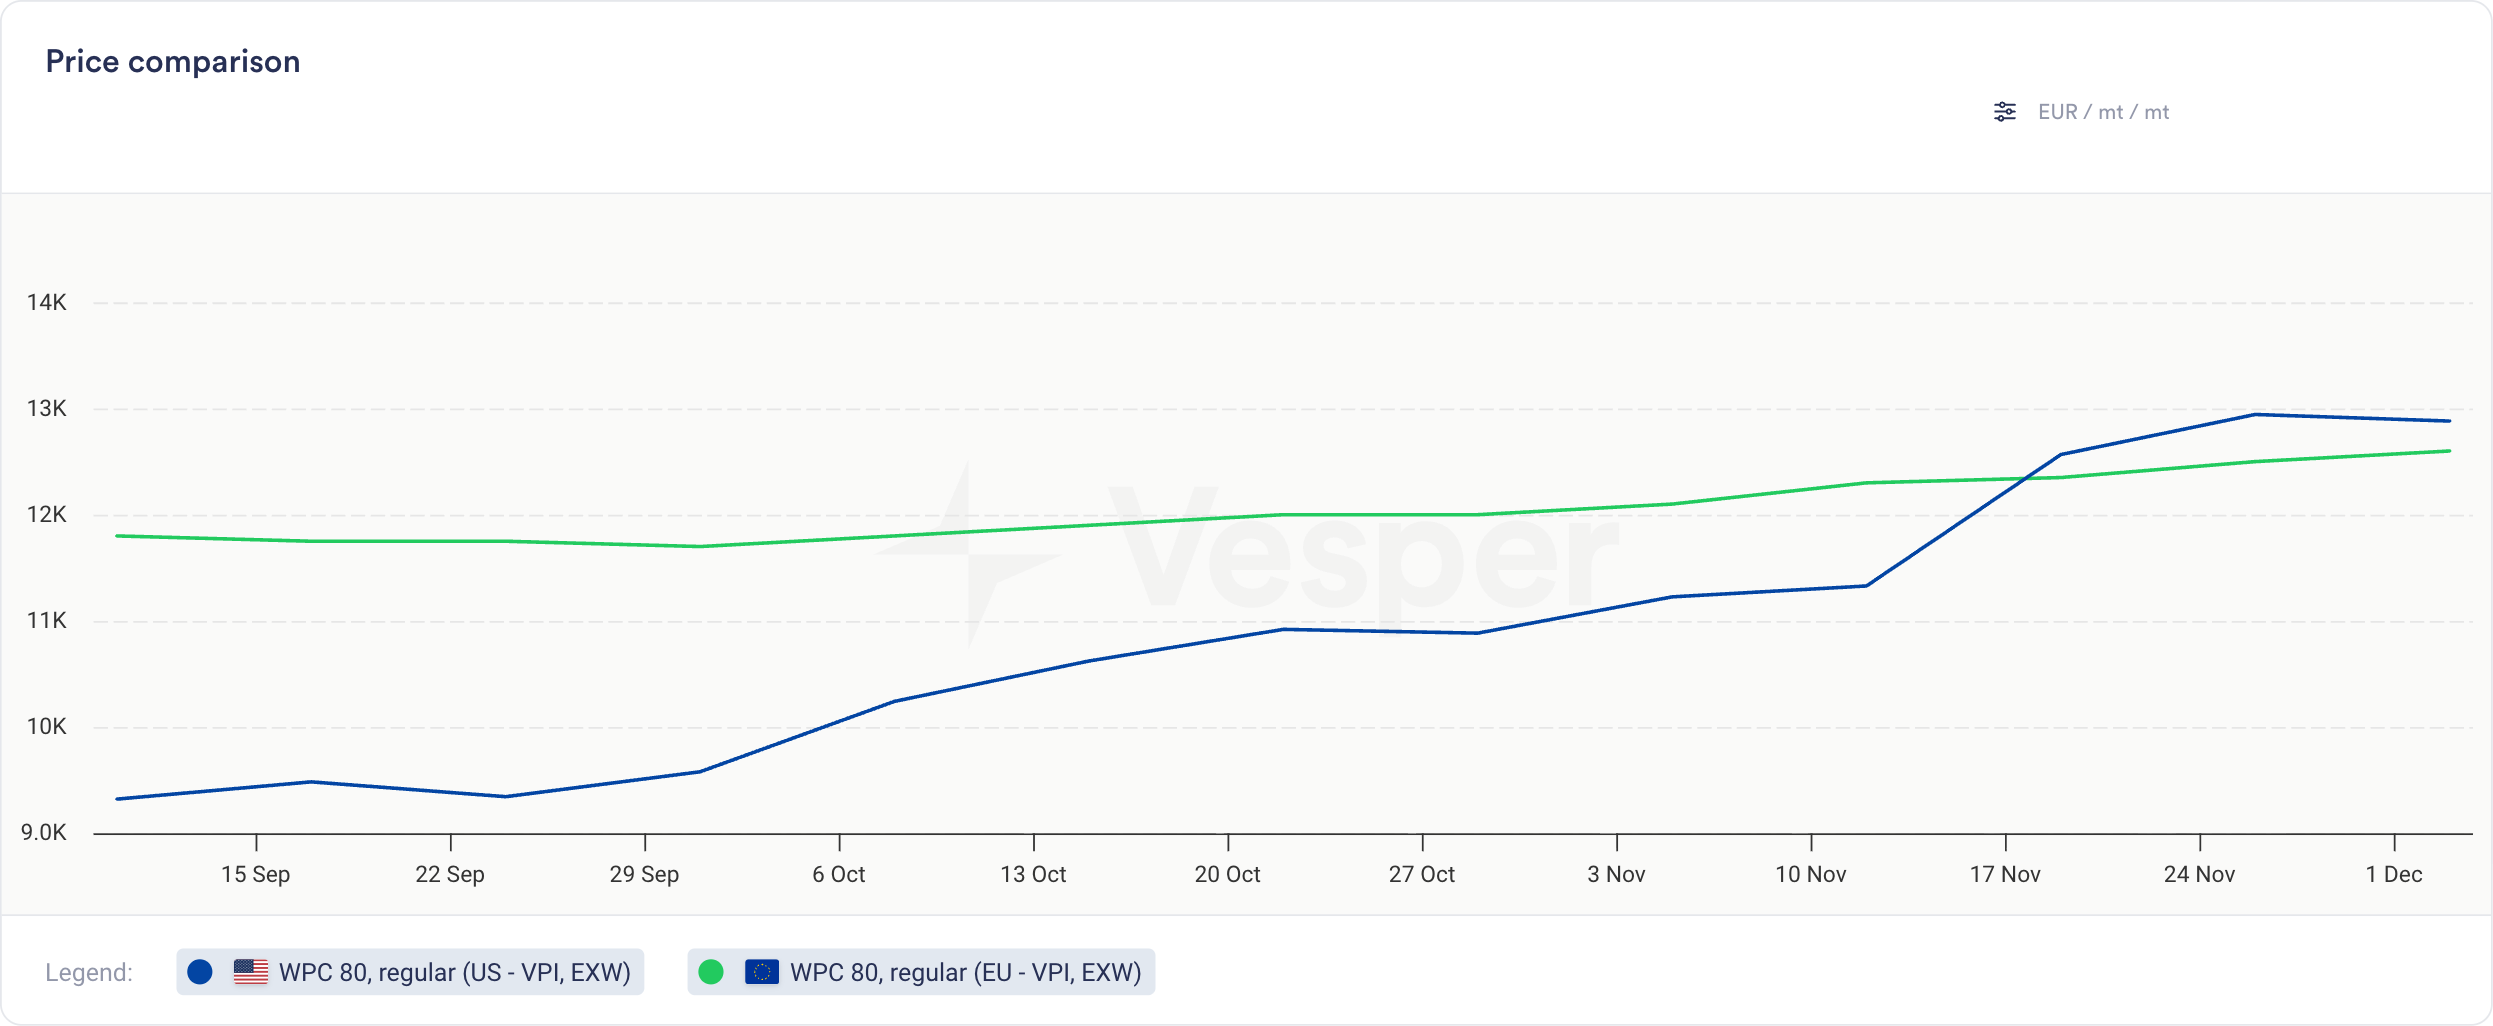
Price Comparison: Compare the new WPC80 Regular prices to the Instant variant and use the Spread function to instantly visualize correlations, spot patterns, and track how the price gap evolves over time.
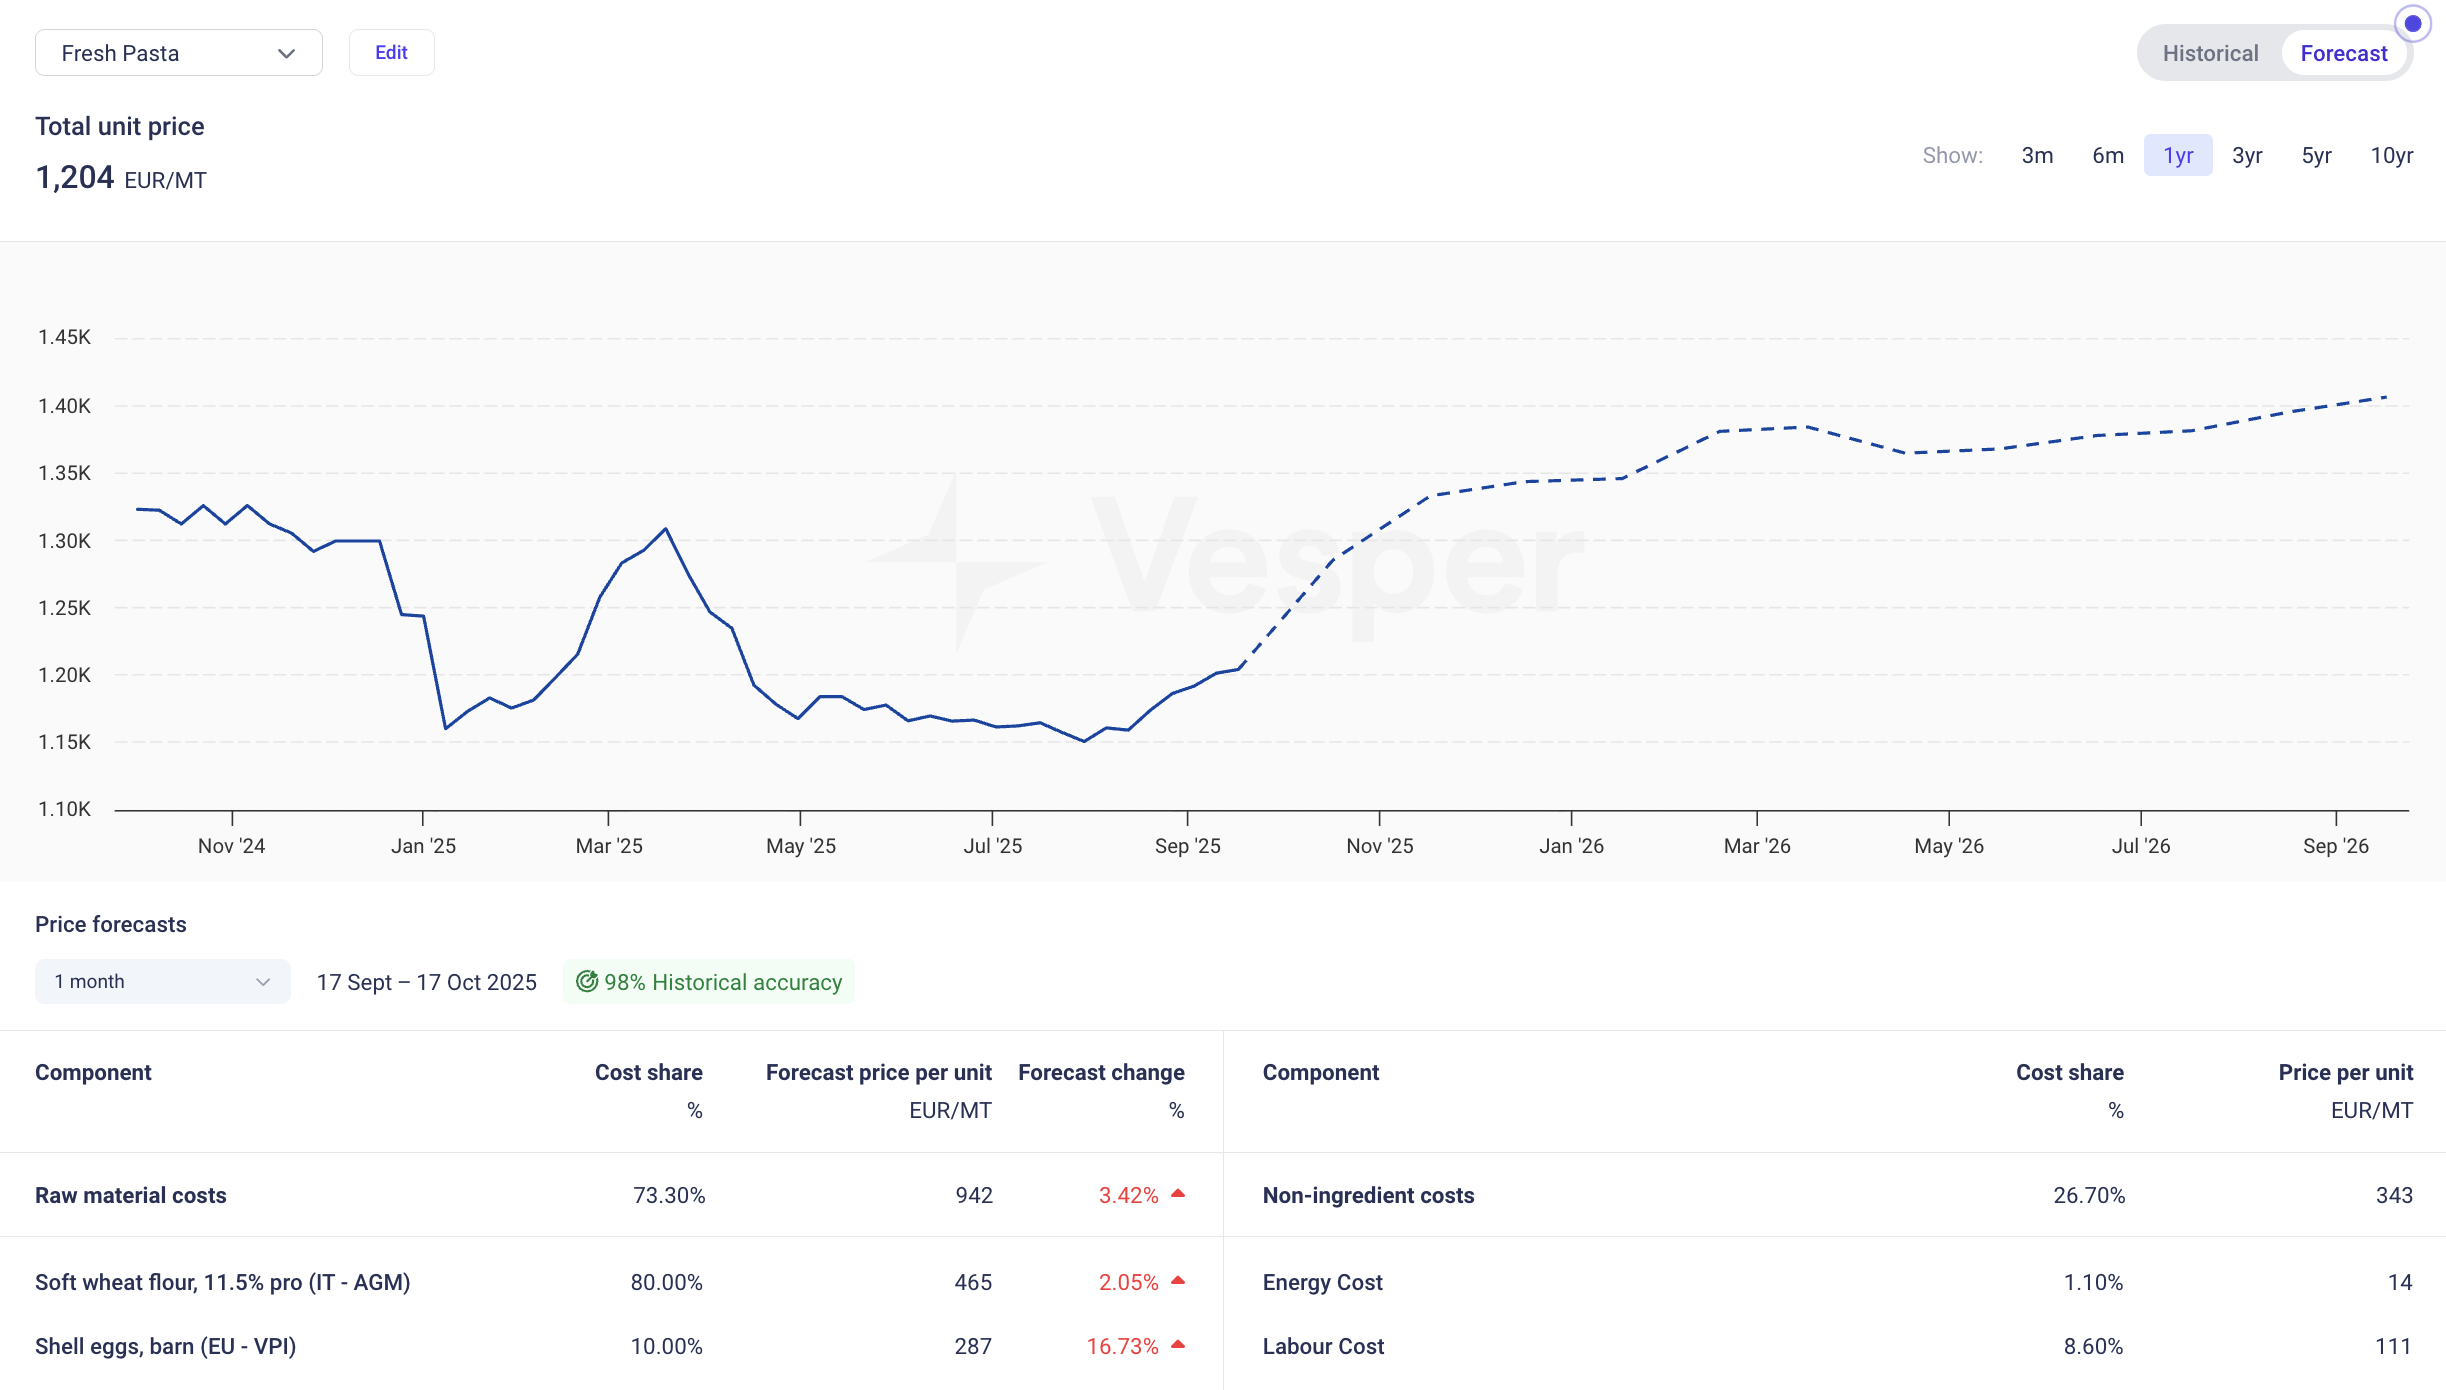
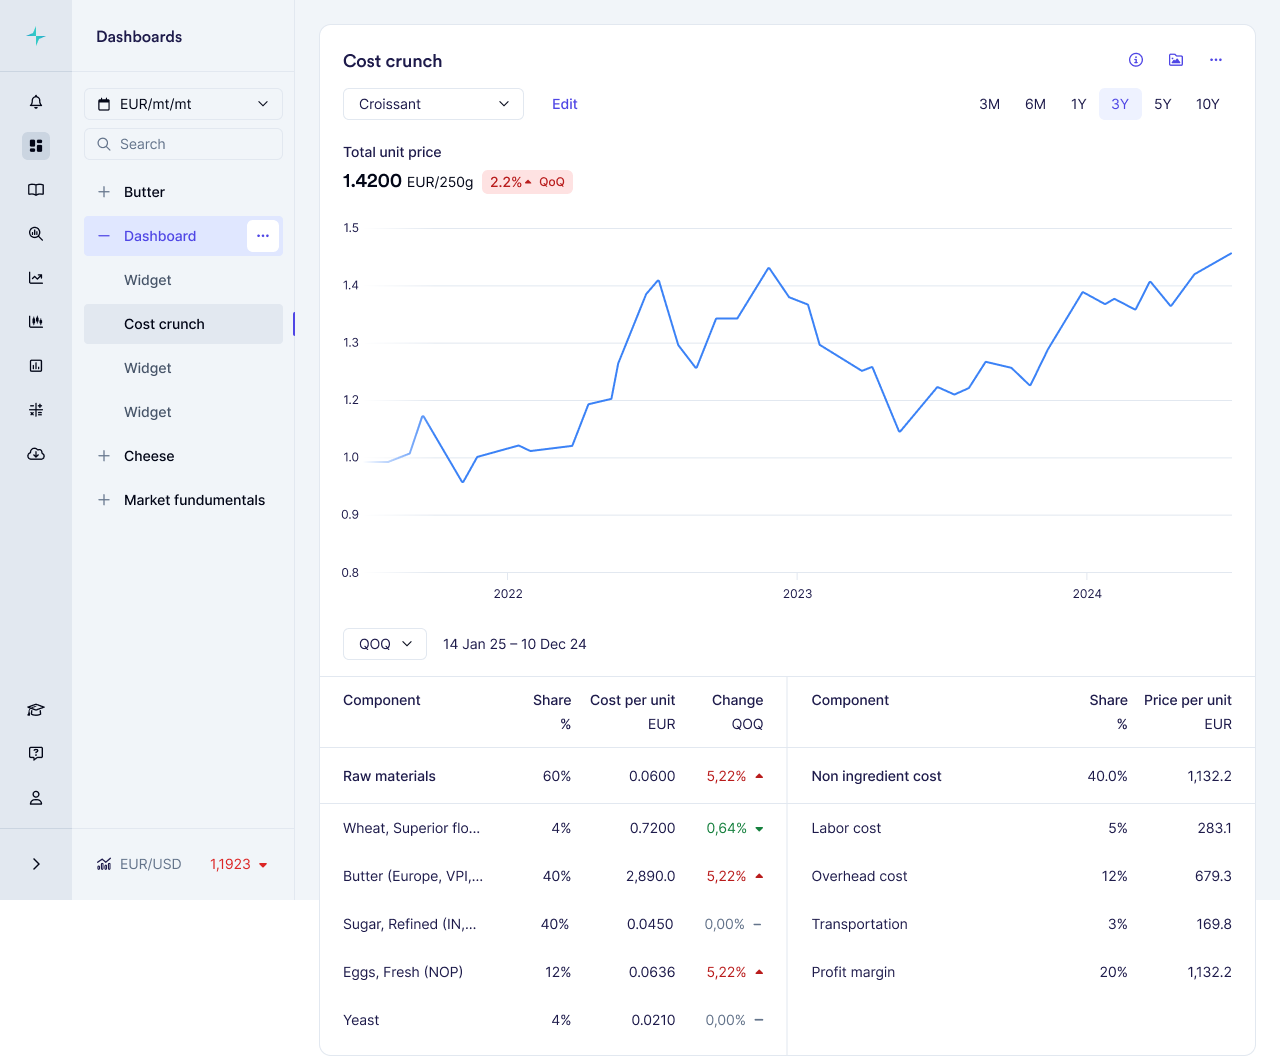
Cost Models: Select these new benchmarks as ingredients in your Cost Models to see product costs with WPC80 Regular as an ingredient.
How to access?
These benchmarks are live for all Vesper users with access to the Dairy module. Contact your customer success manager at [email protected] for help integrating these new indices into your dashboard.