388 monthly price series from Switzerland are now live on the platform, sourced from Agrarmarktdaten, a new Swiss public data source covering Grains & Feed, Dairy, Eggs, and Fruits & Vegetables. This release includes 270 entirely new products.
What's new:
388 monthly price series across four commodity categories
270 newly created products not previously available on the platform
Coverage sourced from Agrarmarktdaten, a Swiss public data provider
Why this matters: Swiss agricultural markets are often unique compared to surrounding countries. A dedicated data source for that region is essential for food manufacturers and retailers in Switzerland. This expansion gives you Swiss-specific benchmarks to compare alongside European and global prices, whether you're sourcing from Switzerland, selling into the market, or building cost models that reflect local conditions.
How to Use It:
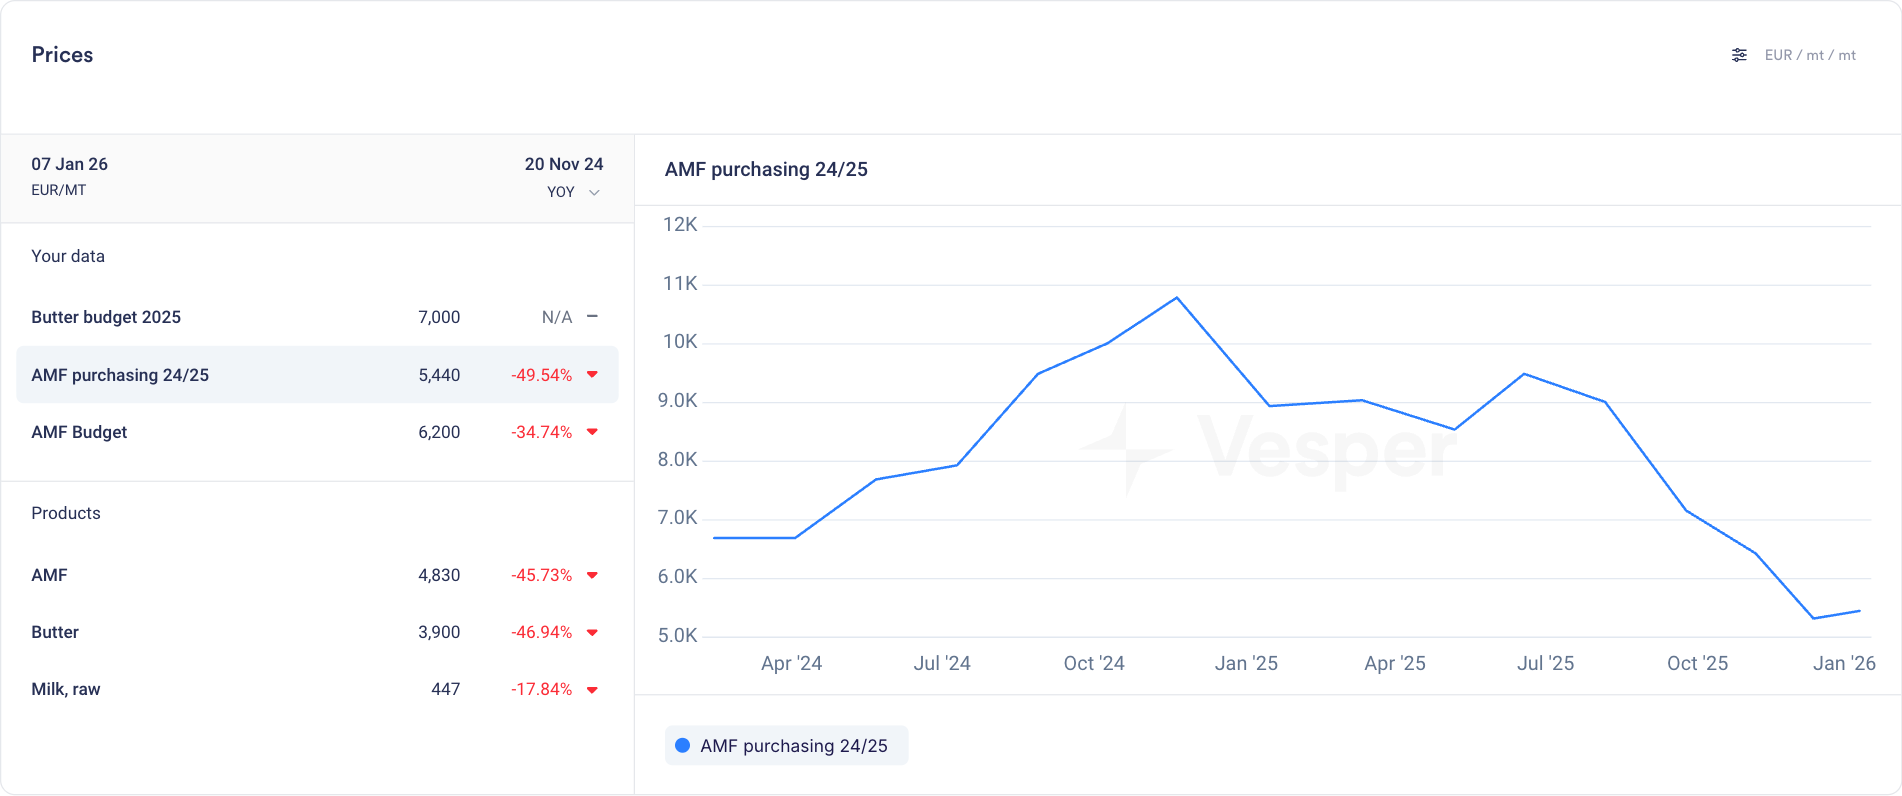
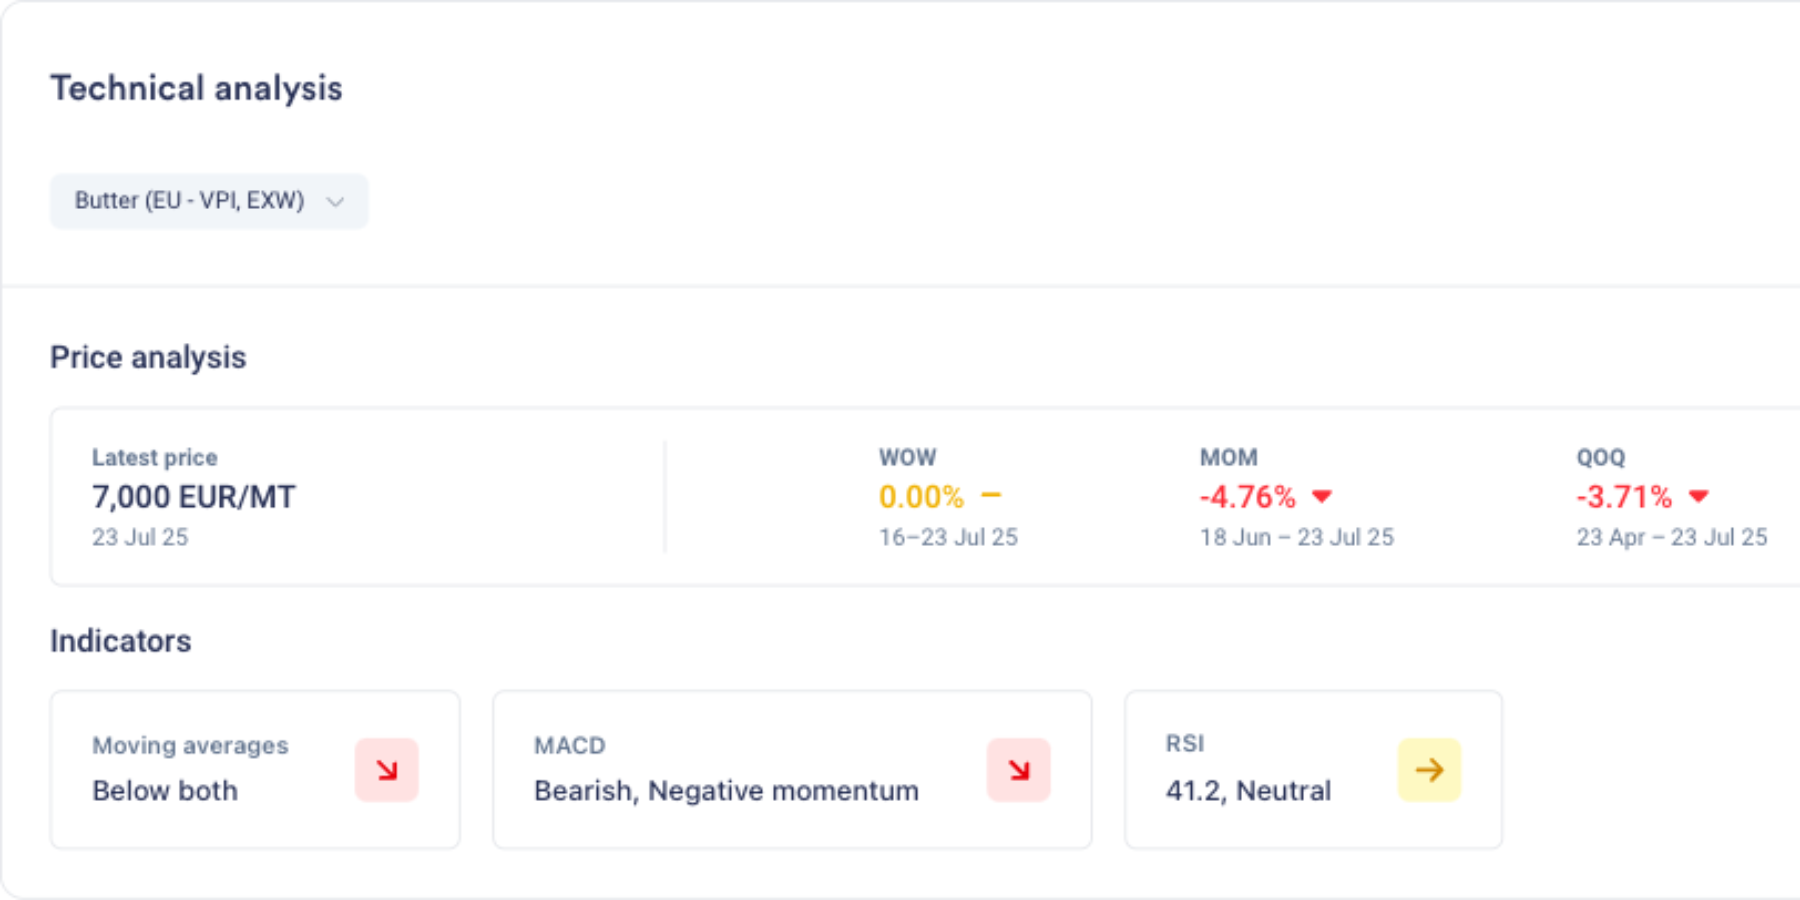
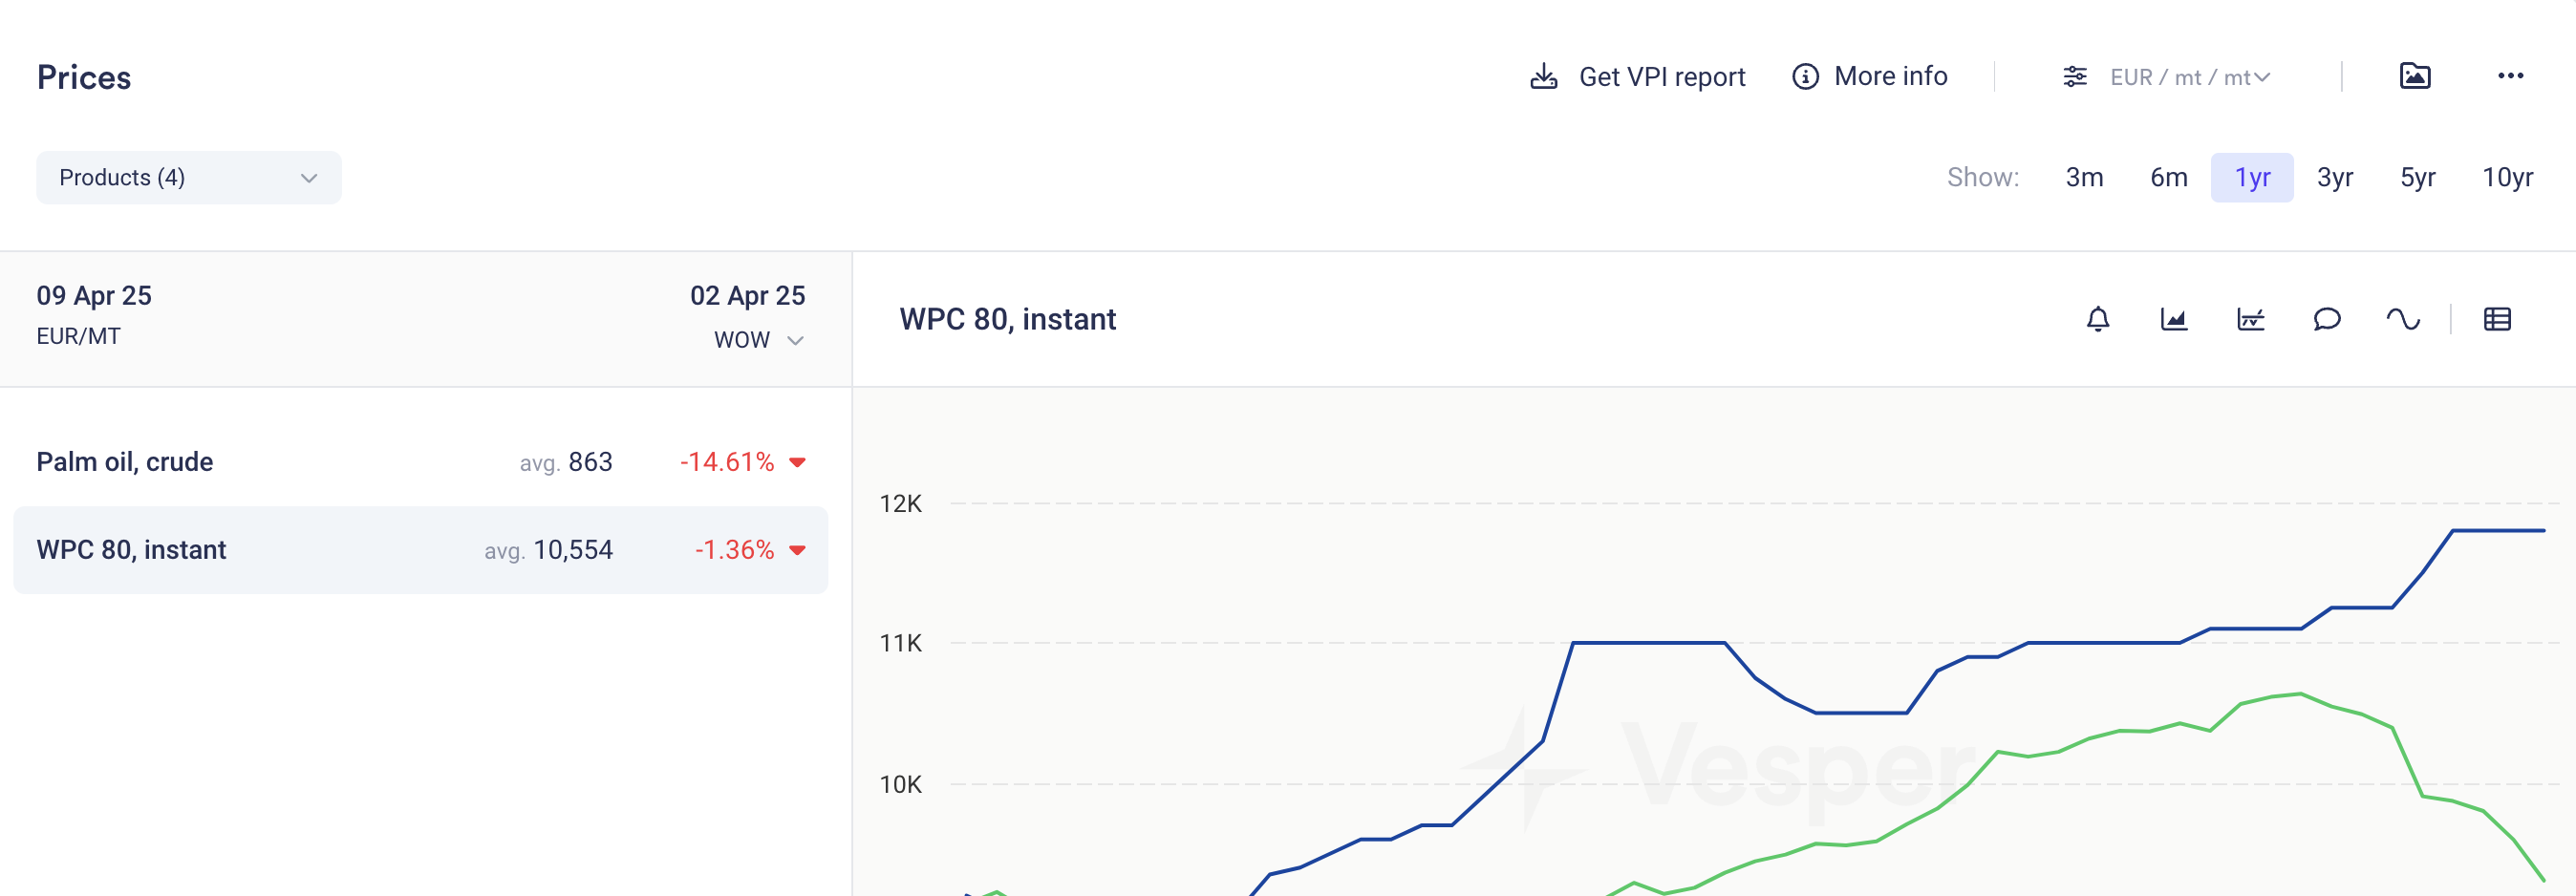
Track Swiss prices in the Prices Widget
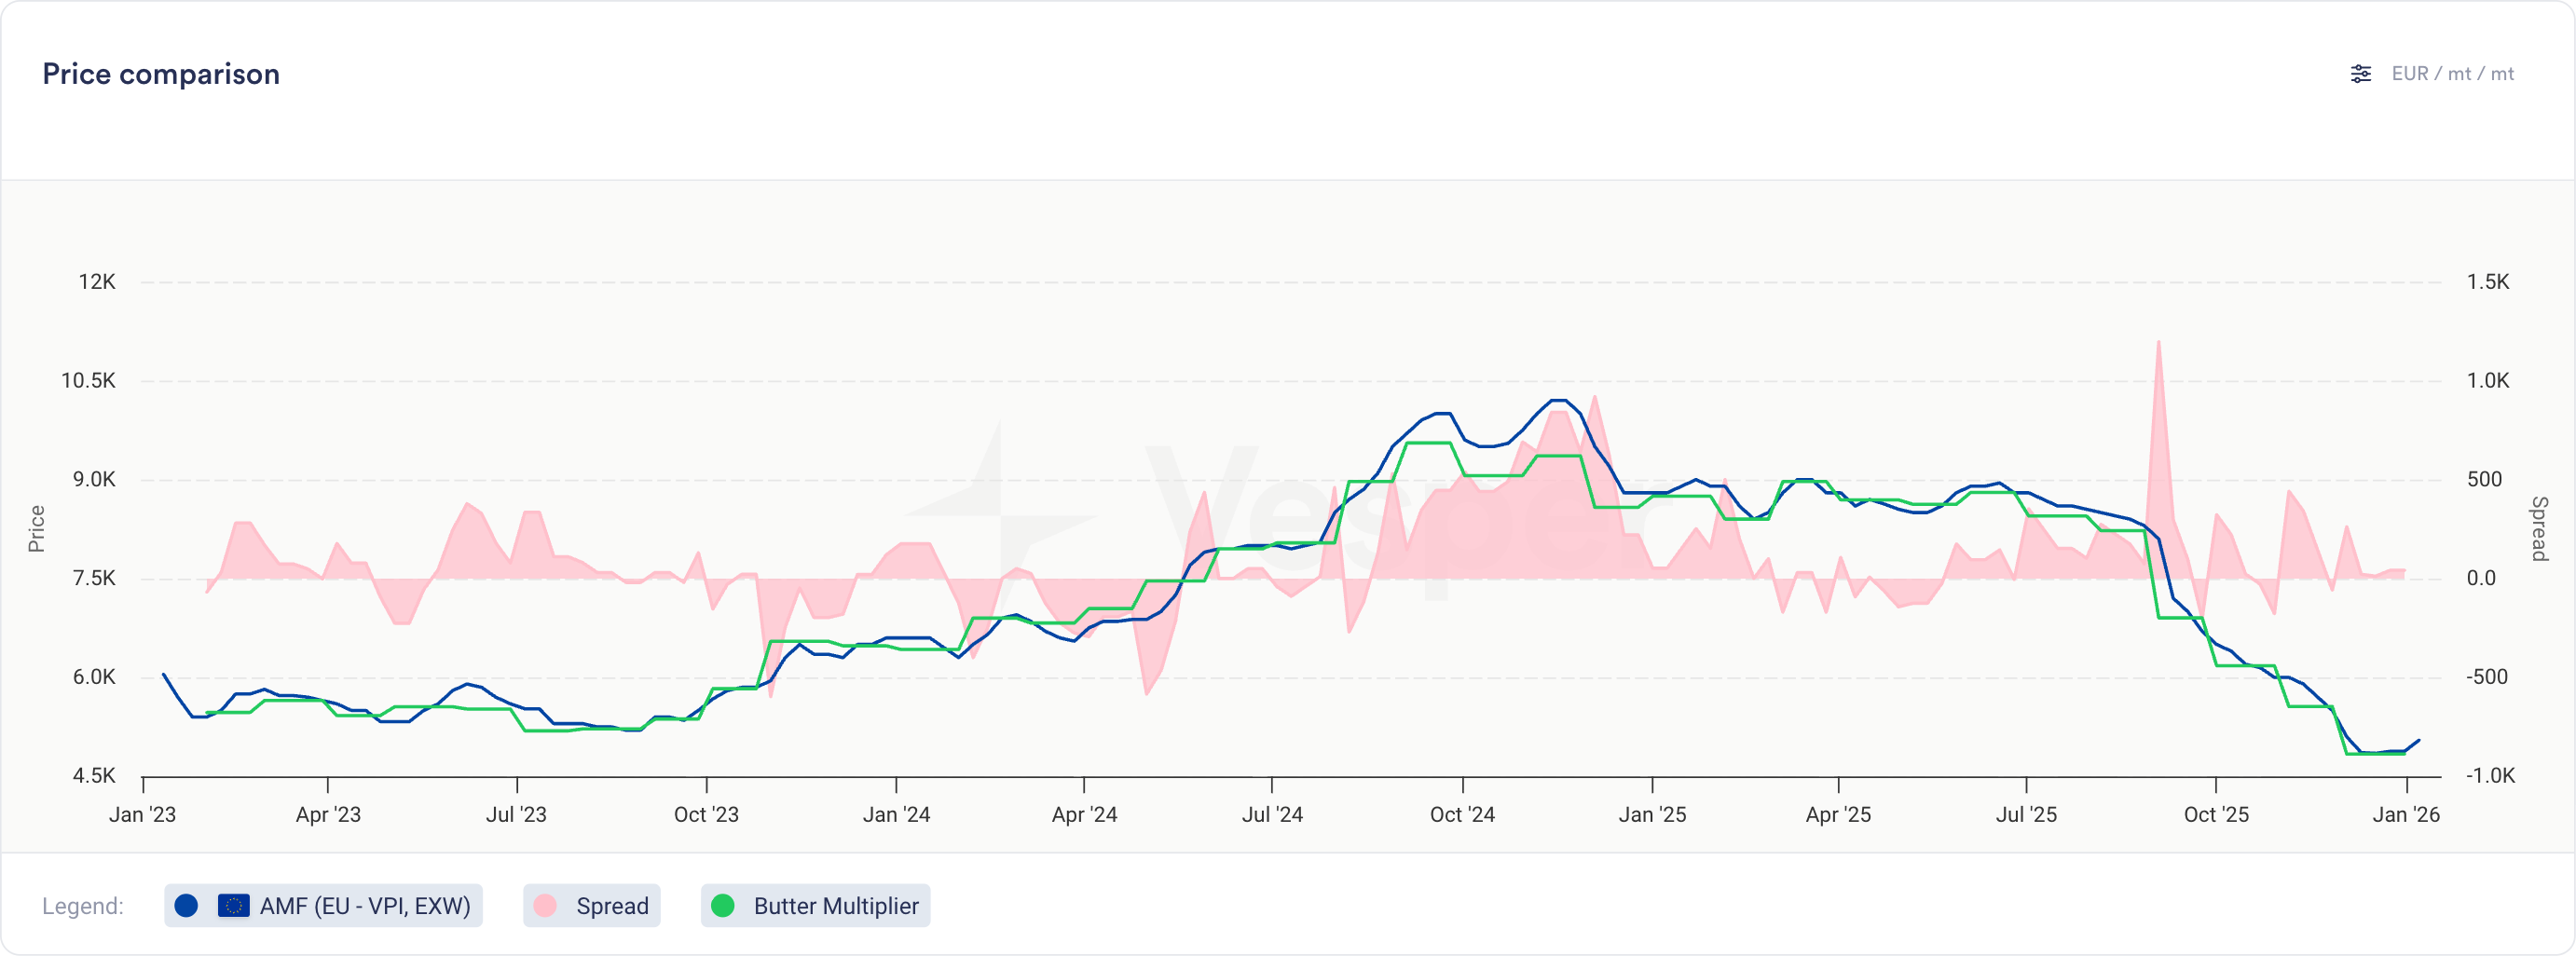
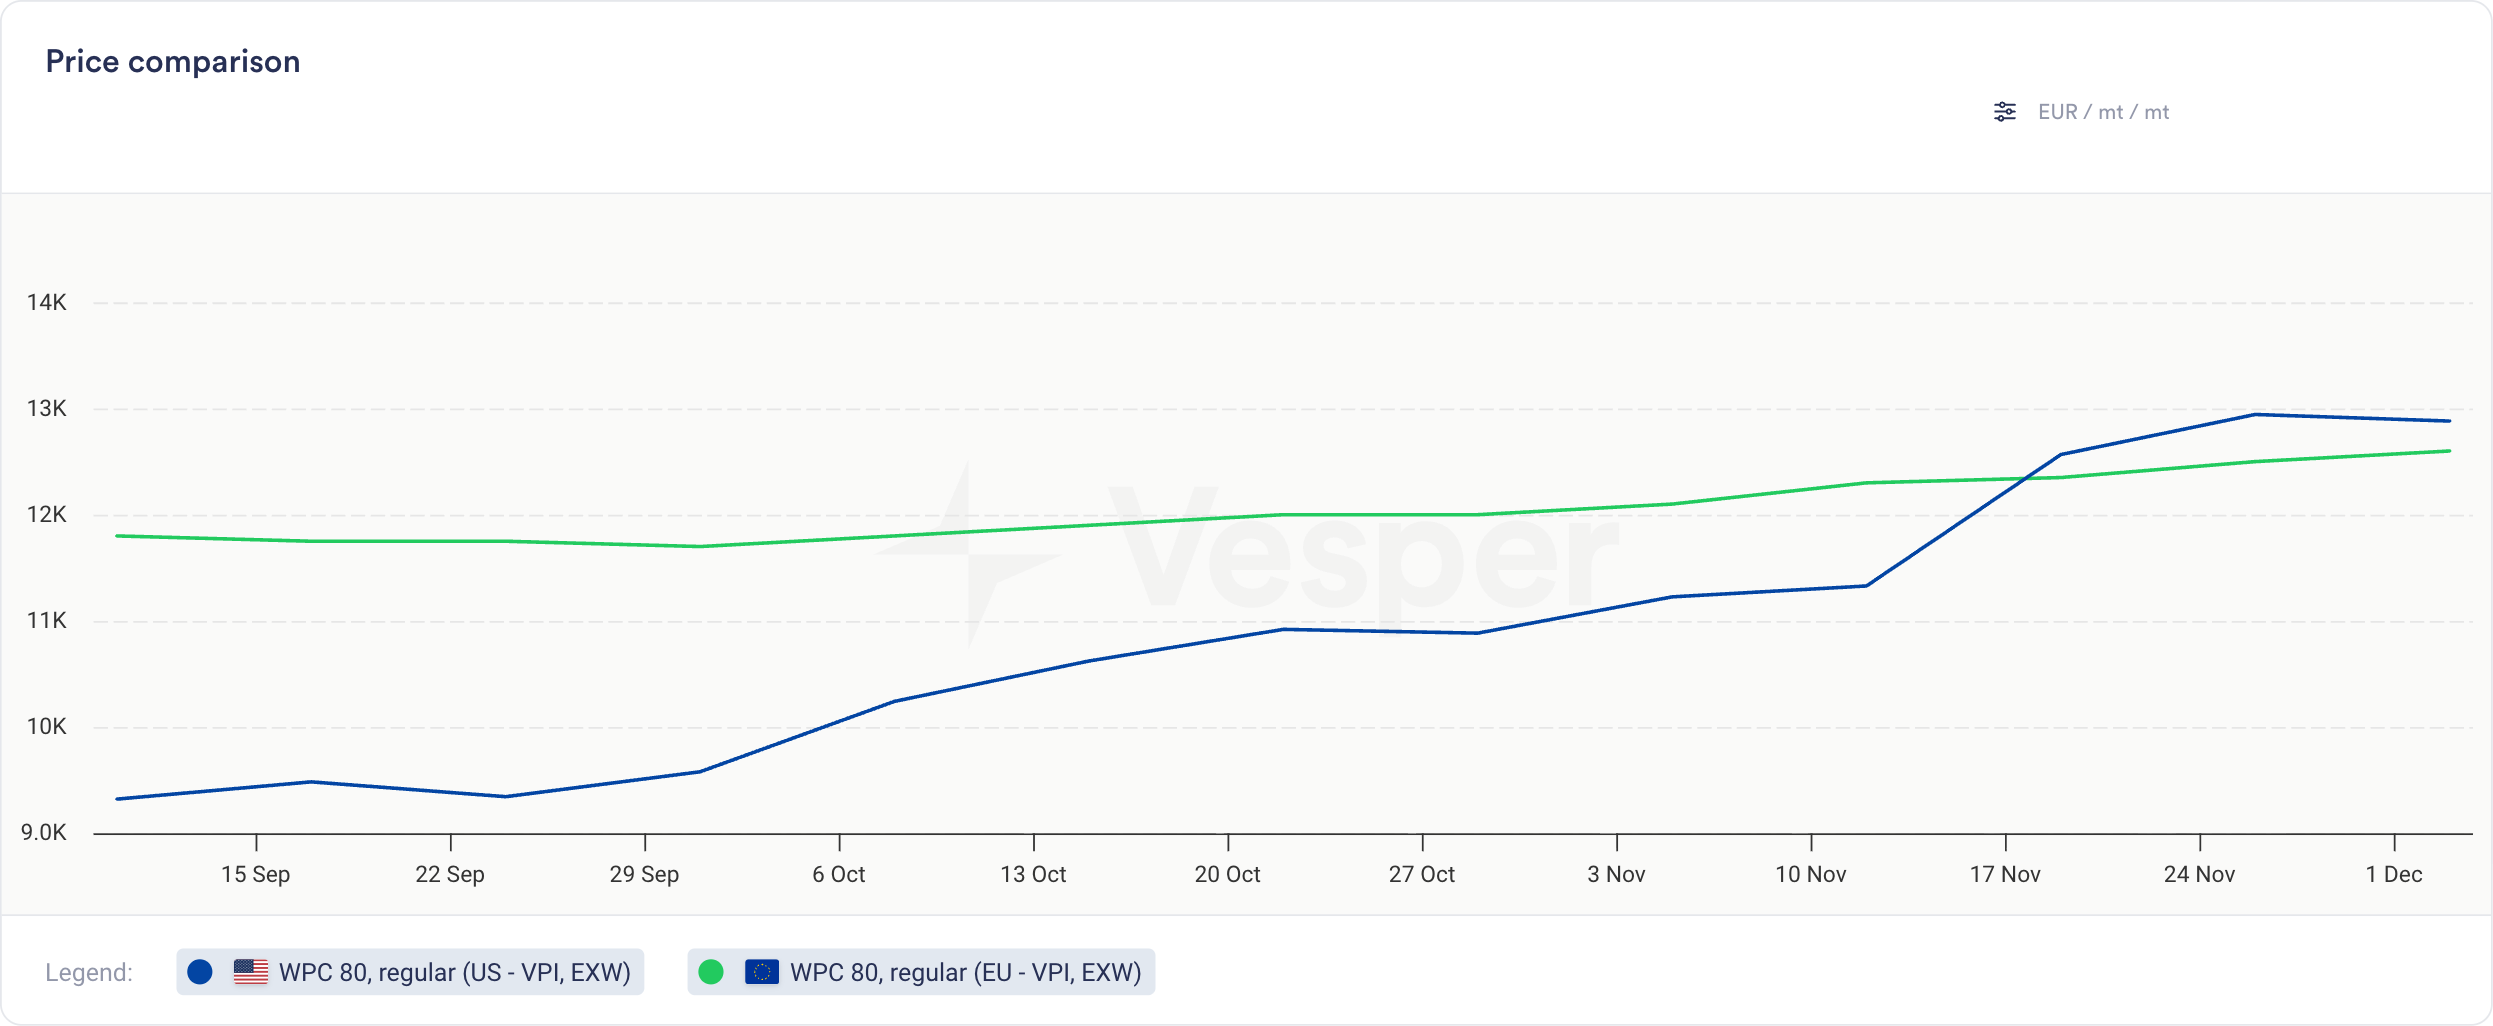
Compare against other European benchmarks in Price Comparison
Incorporate into Cost Models for Swiss-sourced ingredients
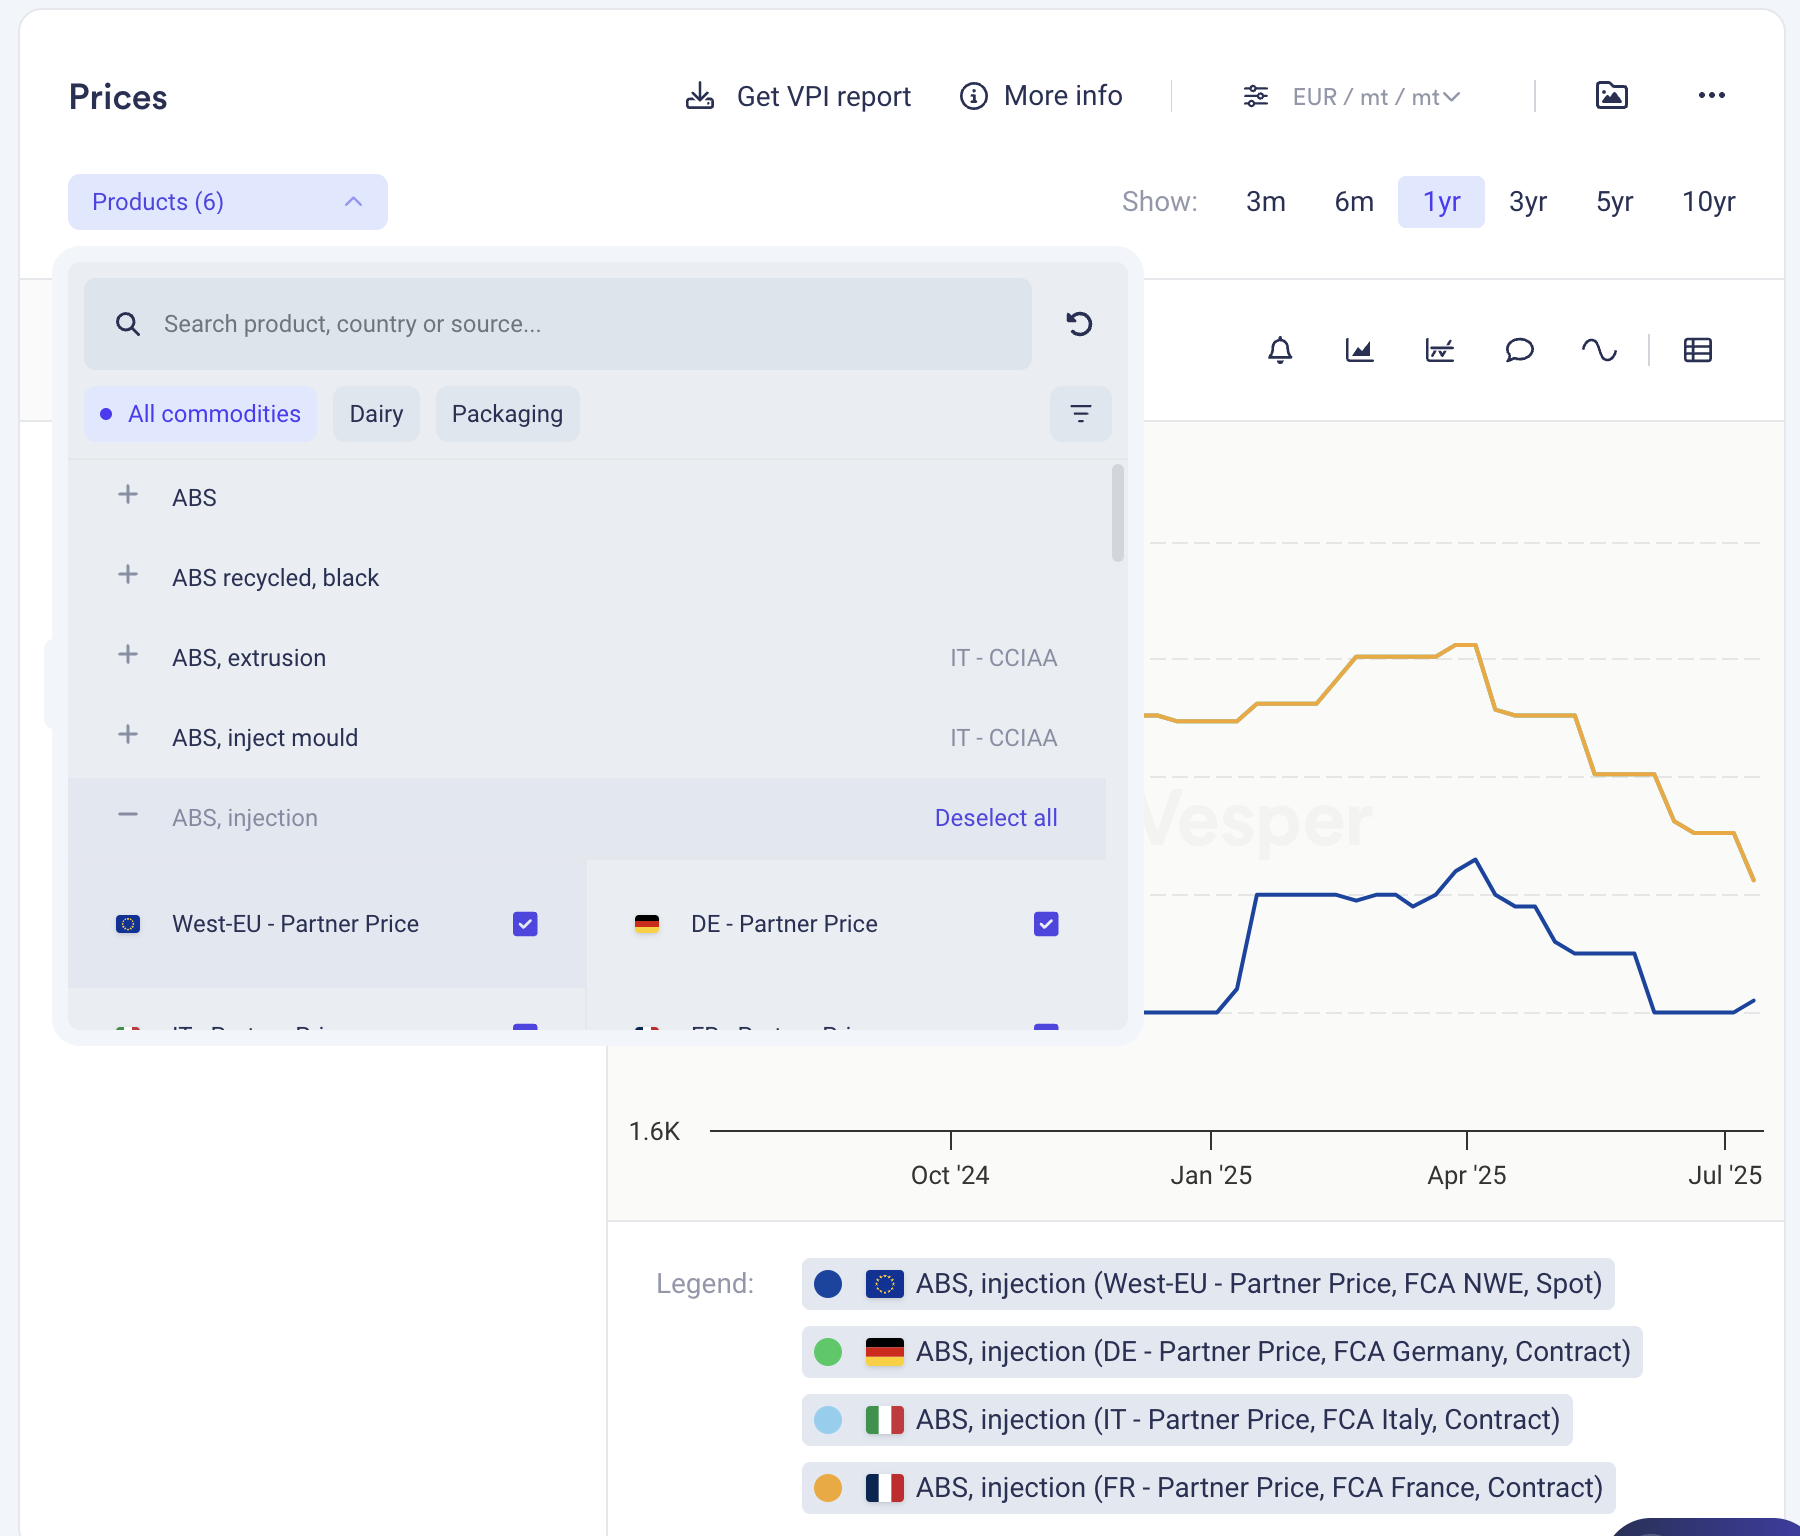
How to access? Add to new or existing dashboards using the search function, or contact your Customer Success Manager at [email protected].