Vesper  Updates

Major US Price Expansion: 286 New USDA Series

by Vesper Team
New
Data
Vegetables & Pulses
Fruit
Meat & Poultry
Food Ingredients
Grains & Feed
Oils & Fats
Herbs & Spices
Chemicals
Sugar & Sweeteners

Vesper now includes 286 new price series from 13 USDA MARS reports, one of the most widely referenced public pricing sources in US agricultural markets. This is our largest single USDA expansion to date.

What's New:

  • Vegetables & Pulses: 107 new price series including potatoes, tomatoes, bell peppers, onions, carrots, broccoli, squash, black beans, pinto beans, lentils, chickpeas, and yellow peas

  • Fruits: 80 new price series covering apples (Gala, Honeycrisp, Fuji, Cosmic Crisp and more), oranges, grapes, strawberries, peaches, pears, bananas, kiwi, and watermelon, including organic variants

  • Meat & Poultry: 39 new price series for beef primal cuts (ribeye, tenderloin, strip loin, chuck, round), lamb (rack, leg, shoulder), turkey (whole, breast, drumsticks, wings), hog, and cattle live/dressed weight prices

  • Food Ingredients: 29 new price series for eggs (caged and free-range across multiple sizes and regions) and ethanol

  • Grains & Feed: 14 new price series for alfalfa, corn (food and feed grade), soybean, DDGS, corn gluten, cottonseed, canola meal, and blood meal

  • Oils & Fats: 8 new price series including choice white grease and animal fat derivatives

  • Herbs & Spices: 5 new price series for jalapeño, serrano, poblano, anaheim chili peppers, and garlic

  • Chemicals: 3 new price series

  • Sugar: 1 new price series

See the complete product list for all 286 series.

Why It Matters:

USDA MARS reports are among the most commonly referenced pricing benchmarks in US agricultural markets. These 286 series bring that coverage directly into Vesper, so you can track US prices for fresh produce, proteins, grains, feed ingredients, and eggs alongside your existing European and global series, all in one place.

How to Use It:

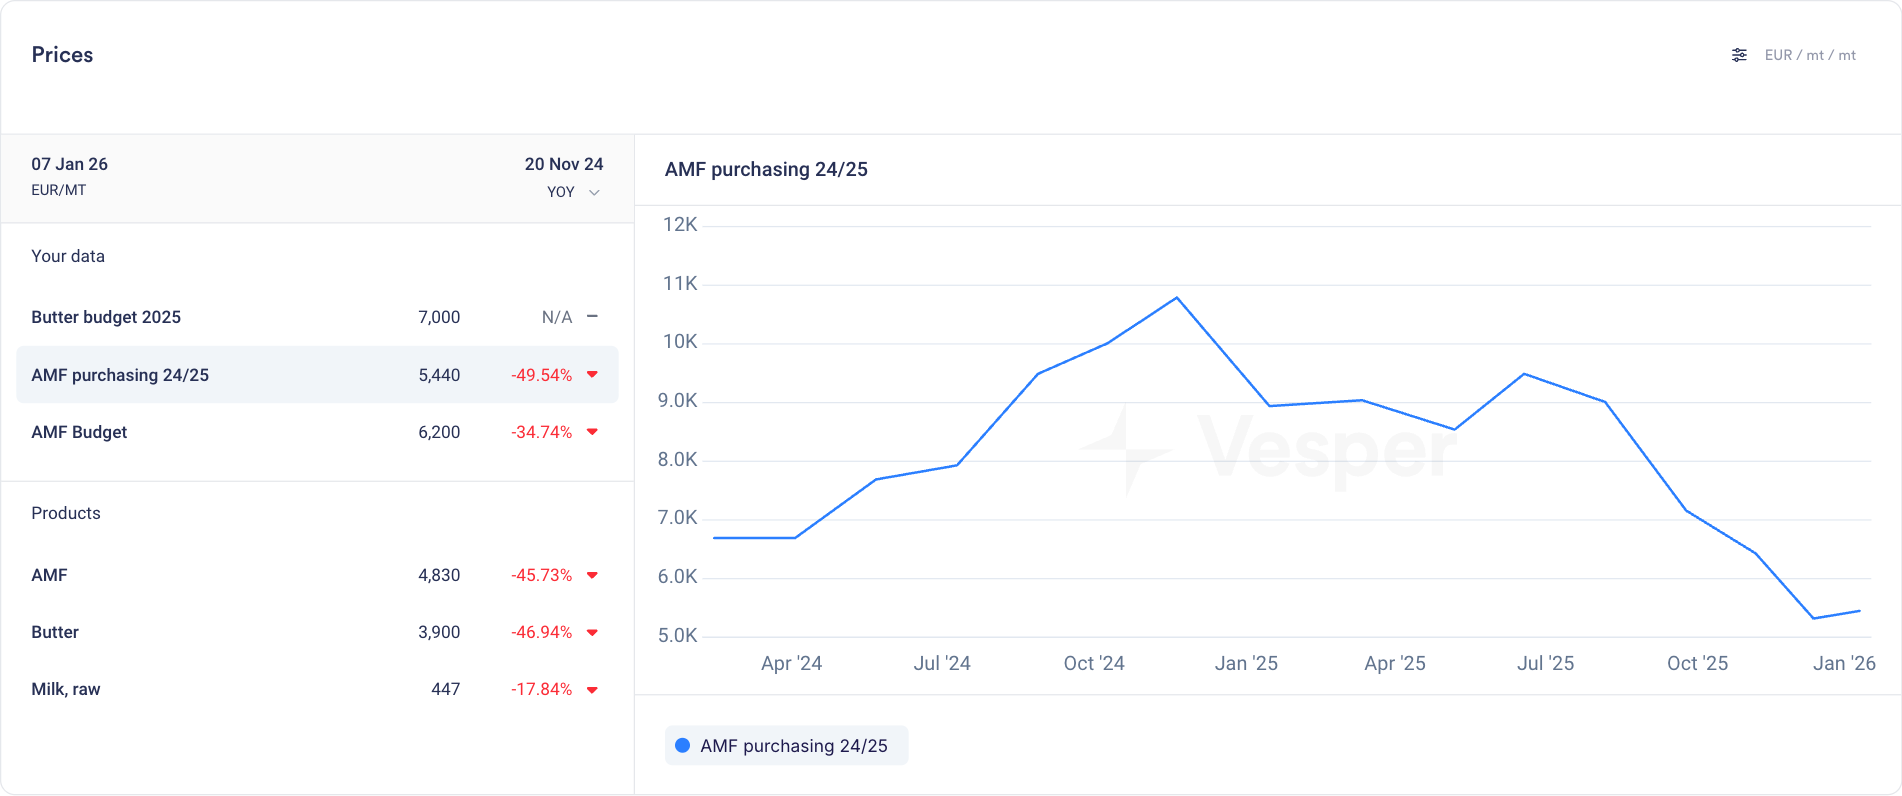
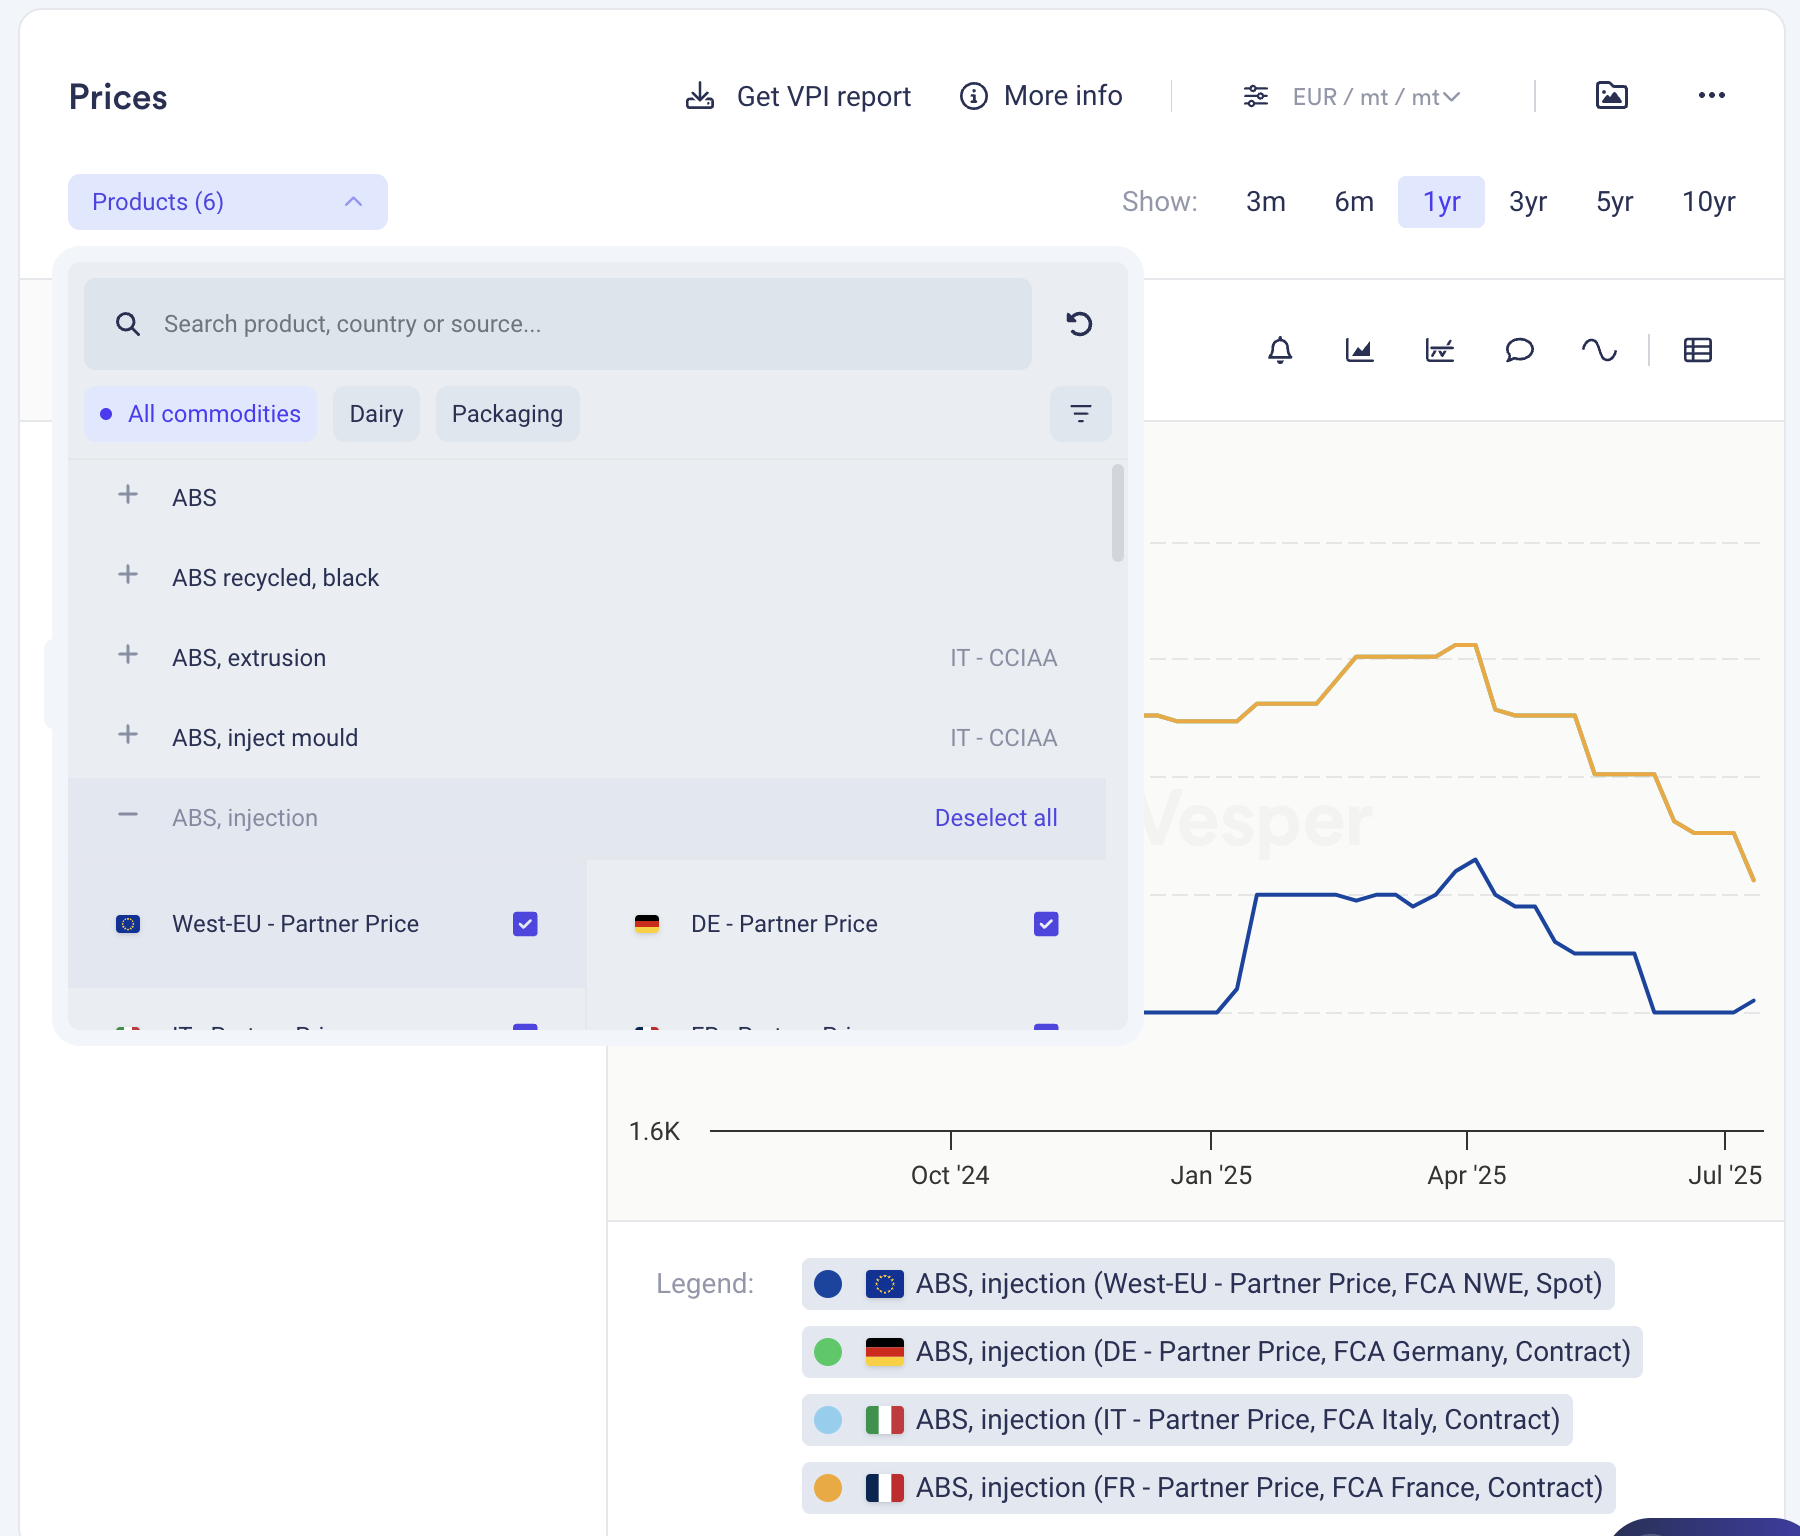
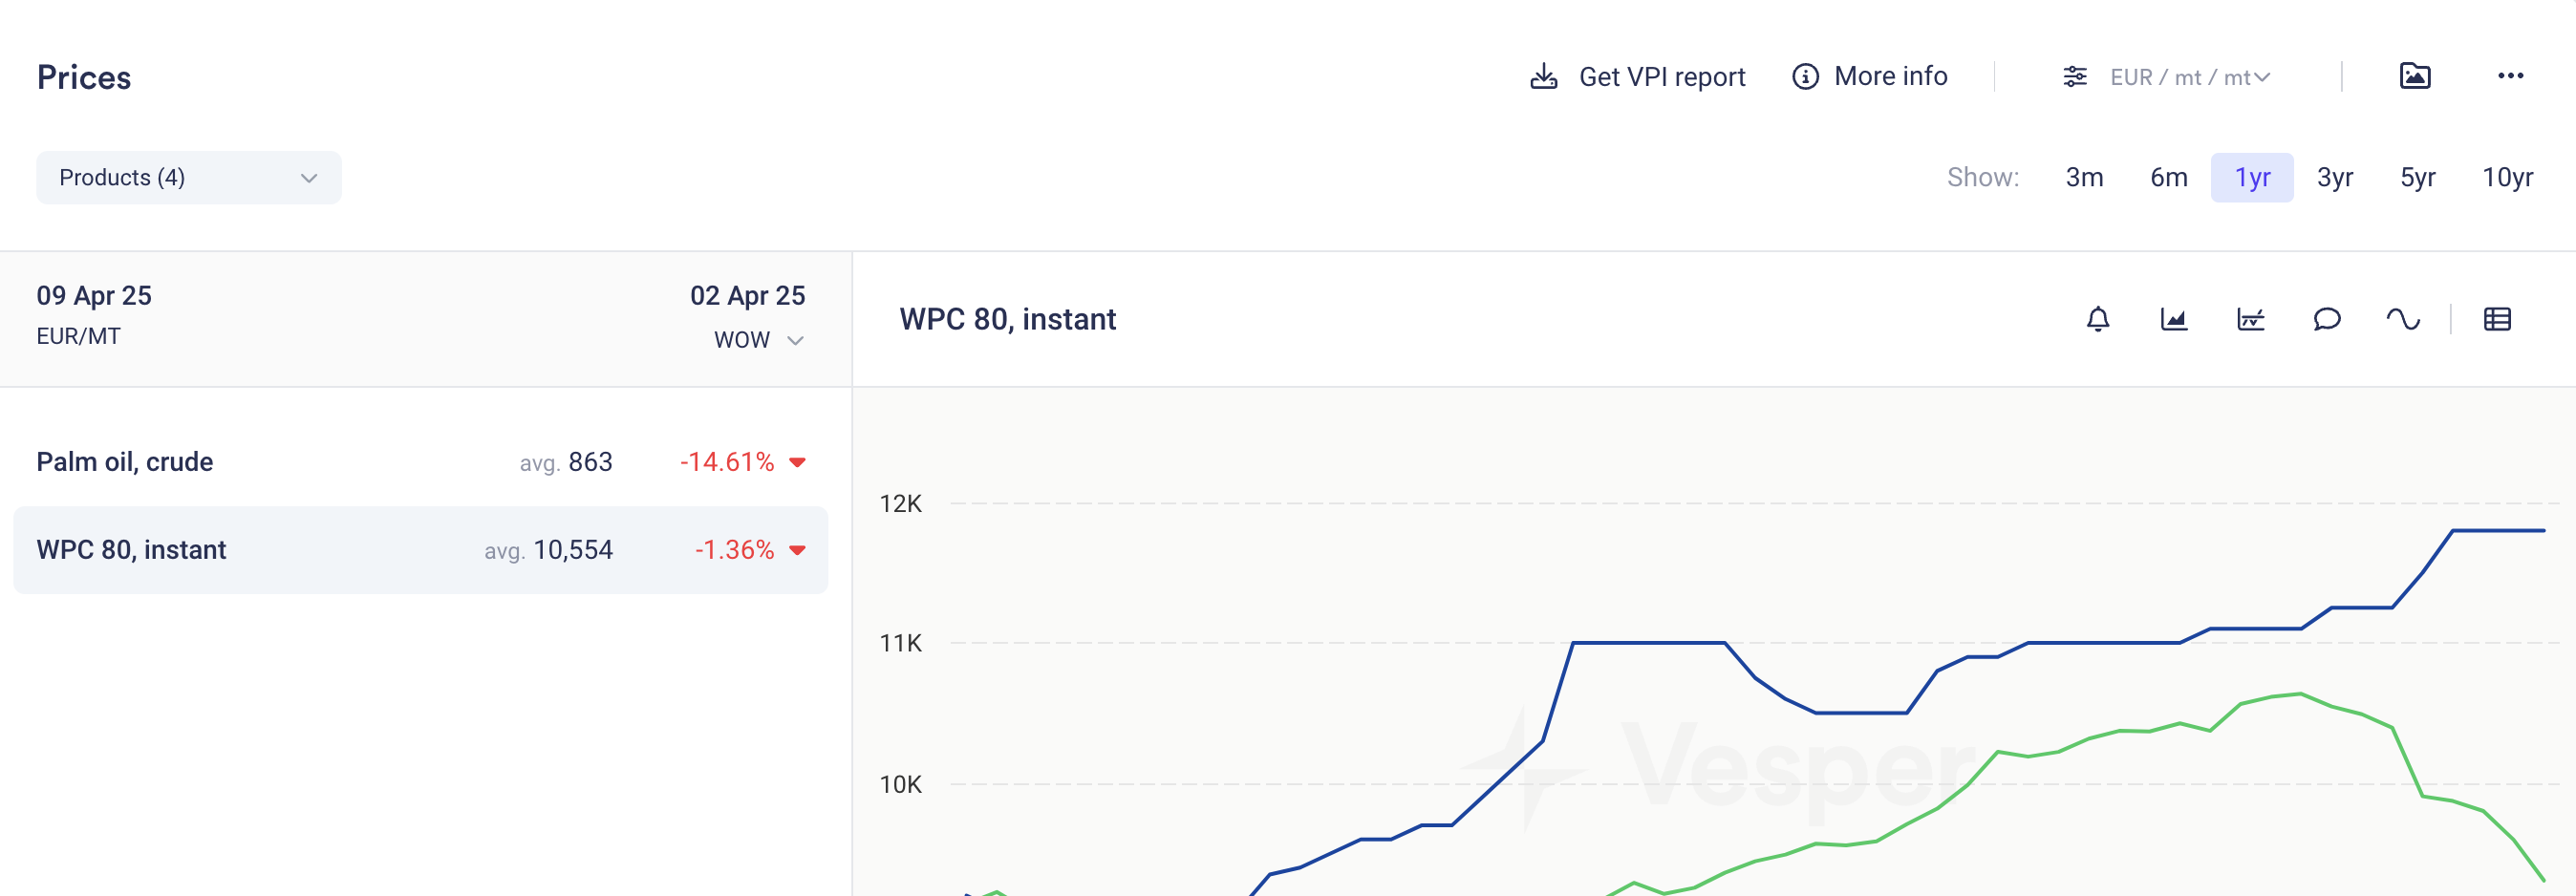
  • Prices Widget: Search for specific products (e.g., "beef ribeye" or "apples Honeycrisp") to bookmark USDA MARS prices alongside your existing series

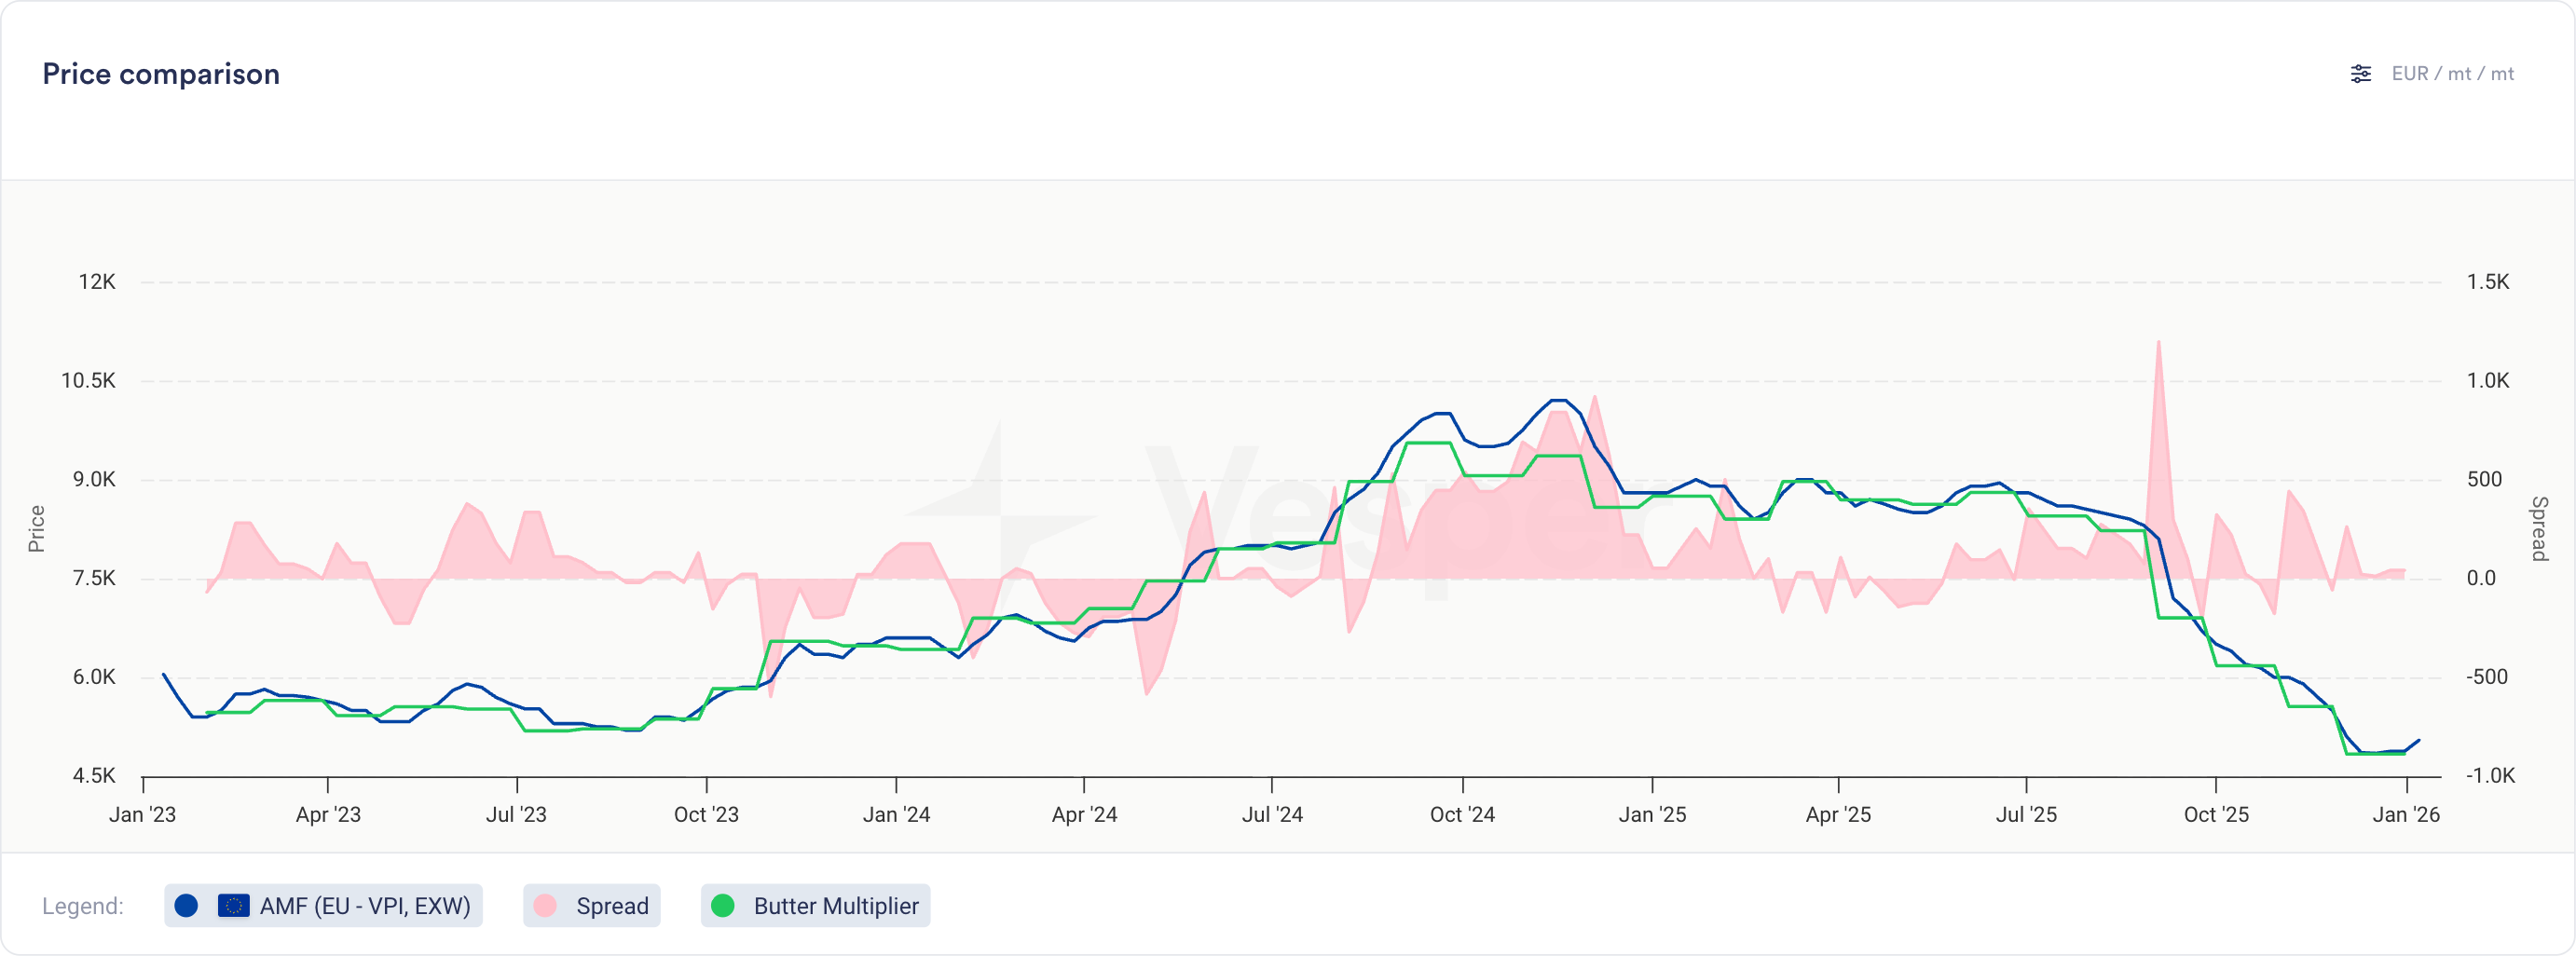
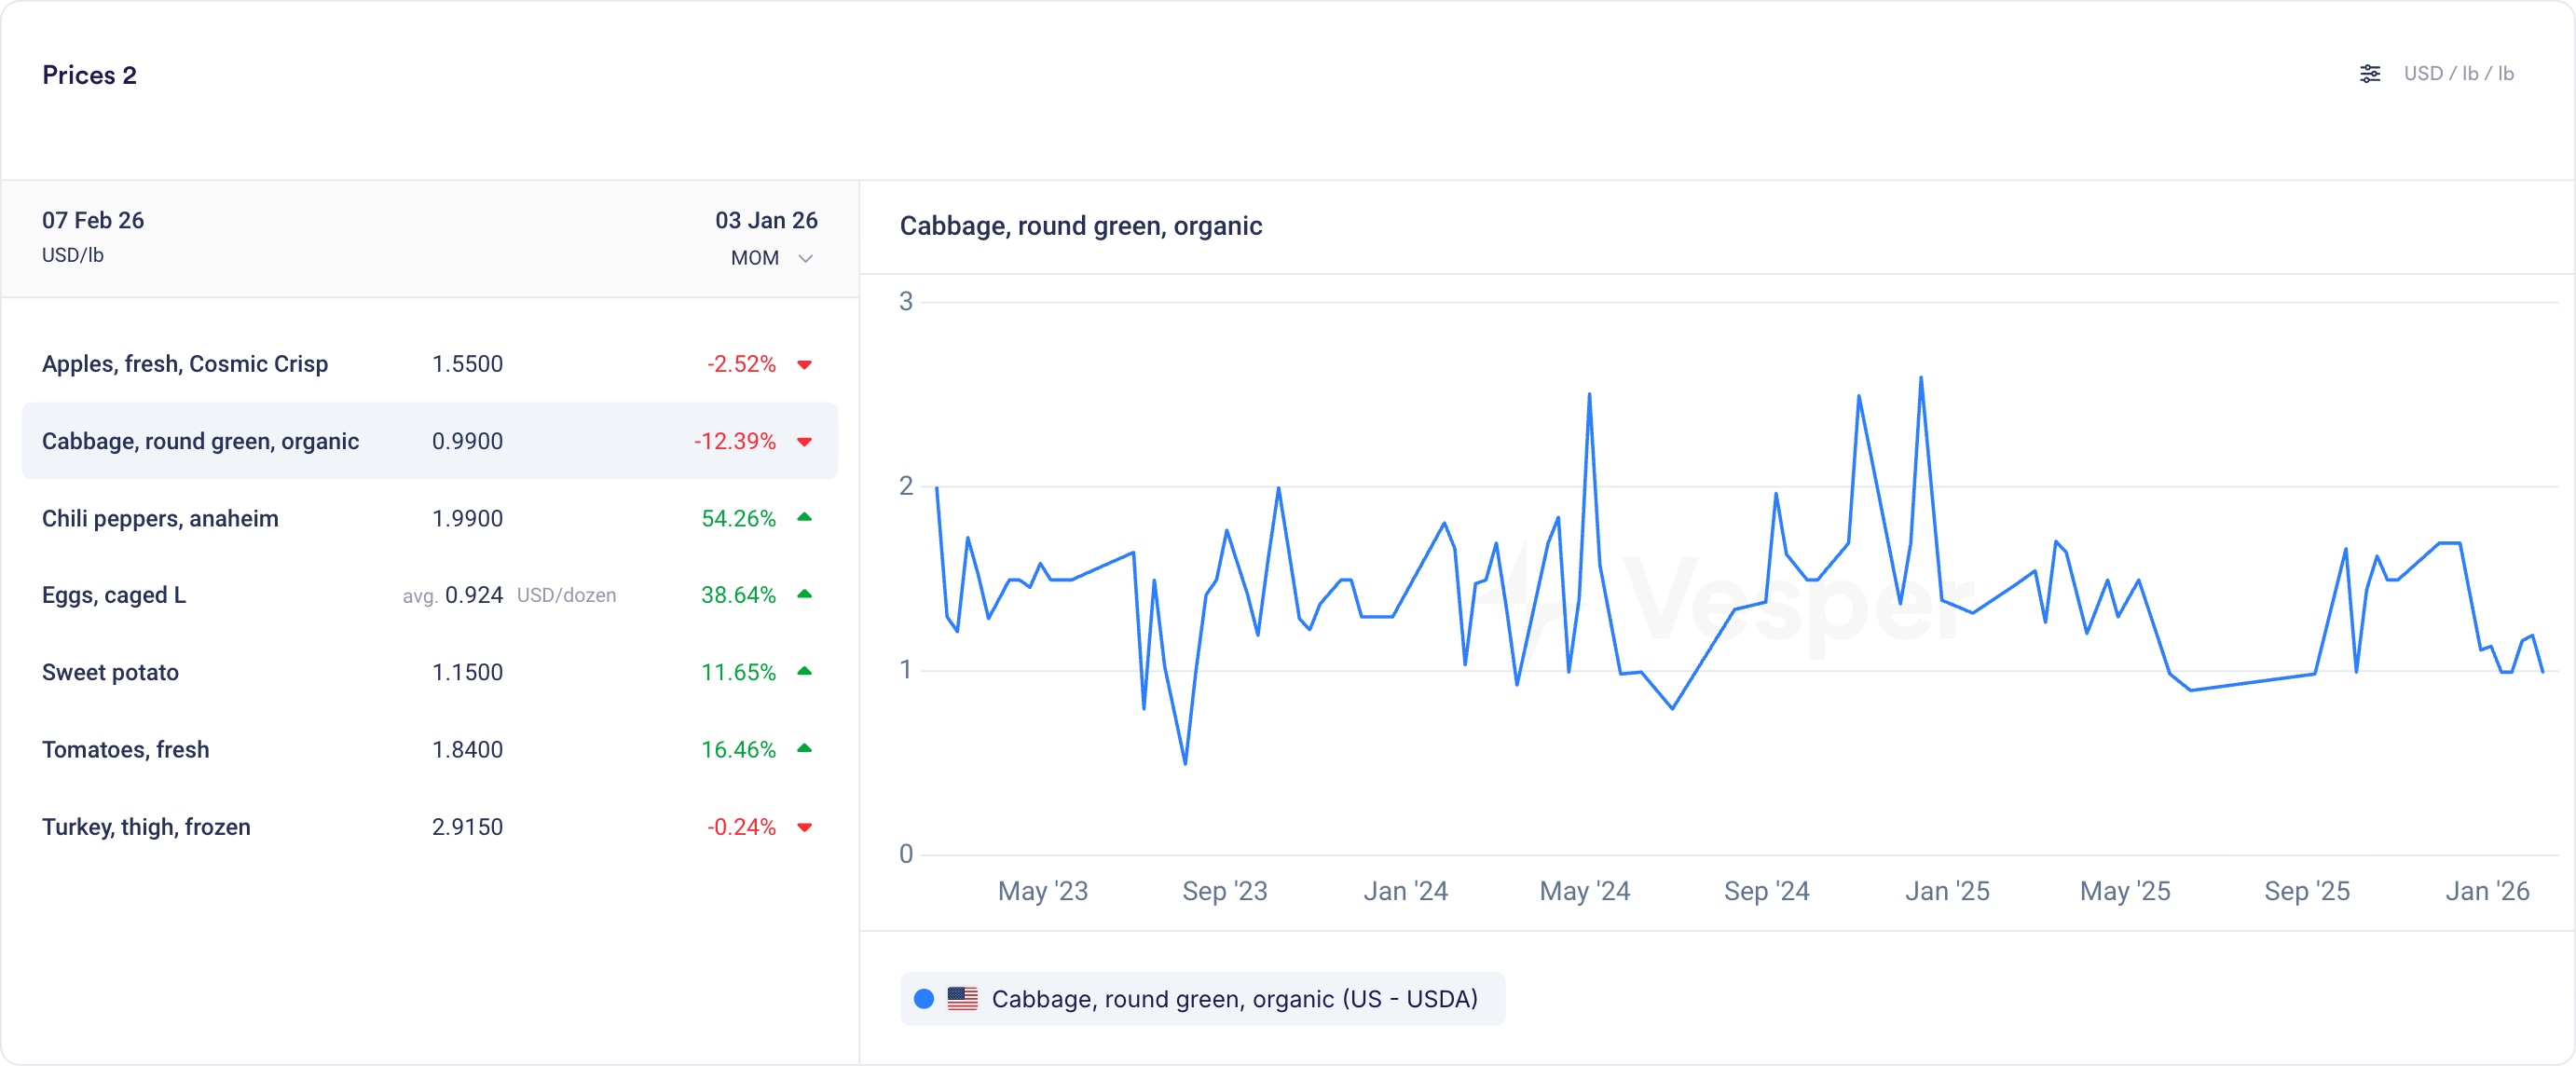
  • Price Comparison: Compare USDA US prices with European or global equivalents for with different prodcut names

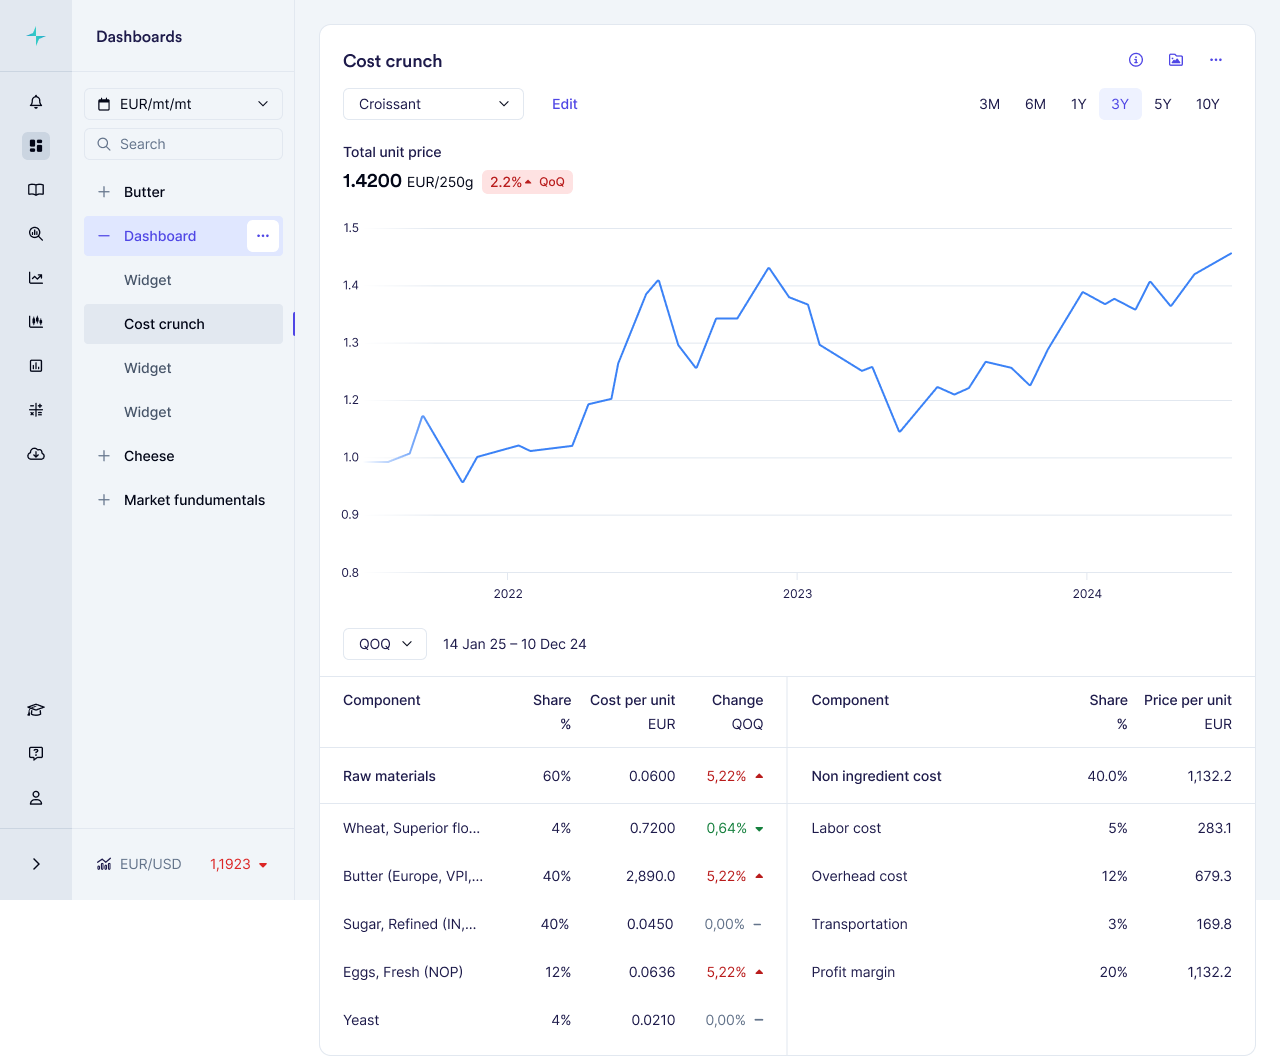
  • Cost Models: Add USDA ingredient prices to your cost models for a more complete picture of US-sourced product costs

How to access?

Add to new or existing dashboards using the search function, or contact your Customer Success Manager at [email protected] for any questions.

205 new Mexico price series from SNIIM

by Vesper Team
New
Data
Fruit
Vegetables & Pulses
Herbs & Spices
Grains & Feed
Nuts, Seeds & Dried Fruits

Vesper has added 205 price series from SNIIM, Mexico's national food price information system. This update includes 168 products that are new to the platform.

What's new:

  • 205 new price series from SNIIM (Sistema Nacional de Información e Integración de Mercados)
  • 168 newly created products
  • Coverage by category:
    • Fruits: 86 series
    • Vegetables & Pulses: 76 series
    • Herbs & Spices: 24 series
    • Grains & Feed: 9 series
    • Nuts, Seeds & Dried Fruit: 6 series
    • Beverages: 2 series
    • Sugar: 2 series

Why this matters:

Mexico is a major origin market for fresh produce, herbs, and specialty ingredients sourced by North American and European food manufacturers. SNIIM data gives buyers an official government reference for regional spot prices. Useful for verifying quotes, tracking seasonal price patterns, and benchmarking cross-border sourcing for categories like avocados, chilies, tomatoes, and tropical fruit.

How to Use It:

  • Prices Widget: search by product name or filter by Mexico as origin market
  • Price Comparison: compare SNIIM prices against other regional sources for the same commodity
  • Cost Models: add Mexican produce prices as inputs to ingredient cost models

How to access?

Add to new or existing dashboards using the search function, or contact your Customer Success Manager at [email protected].

Bring Your Own Data (BYOD)

by Vesper Team, Product Marketing
New
Vesper Toolbox
Data
Cost Models

Upload your own budgets, purchase prices, and supplier quotes directly into Vesper. Your internal data now lives alongside global market intelligence, all in one place.

What's new

  • Add your own data via manual entry or CSV upload

  • Store budgets, contract prices, supplier quotes, or any internal pricing data

  • Unlimited series and products with no caps on what you can bring in

  • All your uploads organized in a new dedicated "Your Data" section

  • Access your data in the Prices widget, Price Comparison, and Cost Models

  • Use the full Vesper toolbox on your own data: visualize spreads, calculate averages, and add notes directly in graphs

  • Use your data as inputs for cost models and custom formulas

Why this matters

Vesper already lets you build custom benchmarks using formulas and cost models. Now you can go further. Bring in your actual purchase history, budget targets, and supplier offers to see the full picture.

  • Track performance: Compare what you paid against what the market did

  • Spot opportunities: See where your prices diverge from benchmarks over time

  • Centralize everything: Stop toggling between spreadsheets and Vesper. Make it your single source of truth.

Your data stays yours

Everything you upload is siloed, secure, and never shared with other users or used in any Vesper Price Index. Your competitive information remains private.

Did you like this update?

LikeNeutralDislike

Dashboard Sharing

by Vesper Team, Product Marketing
New
Vesper Toolbox

Share dashboards with your team or your entire company. Build once, keep everyone aligned.

What's new

  • Share any dashboard with individual colleagues or your whole organization

  • Admins control who sees what: choose specific team members or open it up company-wide

  • Shared dashboards appear in a new "Shared" category in your dashboard list

  • Everything carries over: charts, notes, visualizations, and any customizations you've added

  • Builds on existing cost model sharing, now extended to full dashboards

Why this matters

Dashboards already help you bring together the data that matters most. Now you can make that work once and share the view with everyone who needs it.

  • Weekly reviews: Set up a category dashboard and share it with your team. No more rebuilding the same charts every Monday.

  • Negotiation prep: Build a dashboard with price trends, forecasts, and supplier benchmarks. Share it with colleagues so everyone walks into the room with the same context.

  • Leadership updates: Create a cross-category overview for your CPO or finance team. Keep them informed without scheduling another meeting.

Availability

All users get free access to dashboard sharing during Q1 2026.

Did you like this update?

LikeNeutralDislike

Cost models in Price comparison

by Vesper Team, Product Marketing
New
Vesper Toolbox
Cost Models
Data
Vesper Price Index (VPI)

You can now compare your cost models directly against actual prices and other cost models in the Price Comparison widget.

What's new

  • Cost models now appear as selectable series in the Price Comparison widget

  • Select cost models from the product dropdown, labeled with their cost model name

  • View cost model historical data alongside multiple other cost models, price series, or any combination of both

  • Same visualization and interaction as product prices (line charts, tooltips, trends)

  • Note: Notes cannot be added to cost models

Why this matters

For finished goods, this bridges cost modeling and price analysis:

  • Compare different recipe options to find the most cost-effective formulation

  • Validate actual paid prices against theoretical cost models to spot inefficiencies

  • Track variance trends over time to identify negotiation opportunities

For commodity and ingredient buyers, this opens up new ways to analyze contract structures:

  • Build indices for weighted baskets and compare against other indices or your own prices

  • Model multiplier or fixed cost-plus structures on top of any benchmark

Did you like this update?

LikeNeutralDislike

New: Deselect All Button

by Vesper Team, Product Marketing
Improvement
New
Vesper Toolbox

Clear your widget selections instantly with the new "Deselect all" button in dropdown menus. Start fresh analysis without manually removing each selection or dealing with cluttered views.

What it does: One click clears all active selections in a widget What you can do: Reset widgets to empty state for clean analysis Why it matters: Faster workflow, cleaner screens, less clicking

Find it in the dropdown menus across most widgets.

Did you like this update?

LikeNeutralDislike

Technical Analysis: Interpretable and actionable for all food commodity products

by Vesper Team
New
Vesper Toolbox
Forecasting & Outlook

Summary: Vesper has launched Technical Analysis, a new forward-looking capability that translates complex market behavior into clear, actionable timing signals. Previously reserved for trading experts using specialized tools, technical analysis is now accessible to every procurement professional through simple, visual indicators. This feature helps teams identify optimal buying windows by analyzing price patterns and momentum, delivering straightforward signals that answer the critical question: "When should I act?"—no financial expertise required.

What's New:

  • Three procurement-focused indicators that signal market timing without financial jargon

  • Moving Averages show if prices are trending above or below "normal" levels

  • MACD detects when price movements are accelerating or losing steam

  • RSI identifies when markets are overheated or oversold, highlighting potential reversals

  • Clean visual signals (green/red arrows + Interpreted text) that make complex analysis instantly understandable

Why It Matters: Fundamental data tells you why prices should move, but not when the market will react. Technical Analysis bridges this gap by revealing when markets start believing the fundamental story. In volatile markets where timing can mean the difference between saving and losing on purchases in volatile markets. These indicators help procurement teams spot early trend changes, identify optimal entry points, and avoid buying at market extremes, without requiring trading expertise.

How to Use It:

  1. Add Technical Analysis to any dashboard by using the search function

  2. View the summary panel showing all three indicators at a glance

  3. Green arrows indicate upward pressure/momentum, red indicates downward

  4. Click the extended view for in depth analysis of the indicators

  5. Combine with Vesper's other forward-looking tools for complete forward looking intelligence

Related Features: Technical Analysis completes Vesper's forward-looking toolkit:

  • AI Forecasting predicts where prices are headed (the "how much")

  • Dashboard fundamentals explain market drivers (the "why")

  • Market reports provide expert context

  • Now Technical Analysis reveals entry point (the "when")

Did you like this update?

LikeNeutralDislike

Cost Models: Turn commodity benchmarks into product pricing

by Vesper Team
New
Food Manufacturing
Retail
Cost Models

Summary: Vesper has launched Cost Models, a powerful new feature that transforms individual commodity benchmarks into complete product cost insights. This capability allows food manufacturers to combine weighted commodity benchmarks with standardized non-ingredient costs to build accurate product pricing models, delivering unprecedented visibility into true product economics.

What's New:

  • Build complete product cost models by combining multiple commodity benchmarks with precise weightings

  • Access industry-standard non-ingredient costs (labor, manufacturing, overhead) specific to your region

  • Choose from our template library for common food products or create custom models

  • Track how each component contributes to your total product cost with automatic updates whenever source prices change

Why It Matters: With record-high volatility across food commodities, understanding how ingredient changes impact finished products is critical for maintaining margins. Cost Models provide complete cost structure visibility for your entire organization: procurement teams can verify supplier price increases, finance can track margin impacts across product portfolios, and sales teams can justify price adjustments to customers with independently verified data. Non-ingredient costs can represent up to 47% of total product costs—a critical component that's now visible alongside your commodity benchmarks.

How to Use It:

  1. Access Cost Models through the main dashboard menu

  2. Choose between starting with a template or building a model from scratch

  3. Select ingredients from your available commodities and assign precise weightings

  4. Add country-specific non-ingredient costs by selecting your industry and location

  5. Save your model to track cost evolution over time as prices update automatically

Related Features: Cost Models integrates seamlessly with Vesper's existing capabilities:

  • Individual commodity price benchmarks (VPI, Partner prices, and Public benchmarks found in prices widgets)

  • Incorporate into your own custom dashboards

  • Coming in Q3 2025: Forecasting capabilities for your cost models

Did you like this update?

LikeNeutralDislike

Custom Units Per Widget

by Vesper Team
New
Vesper Toolbox

Summary: Vesper has enhanced dashboard customization with the ability to set unique currency and unit preferences for each individual widget. This highly requested feature allows users to display multiple markets with different measurement standards side by side in their most relevant formats.

What's New:

  • Individual currency and unit settings for each widget

  • Widget-specific customization that persists independently of general settings

Why It Matters: Markets operate with different standards across regions and commodities. This enhancement eliminates the need to constantly toggle between general unit settings when analyzing diverse markets simultaneously. Users can now create truly customized multi-market dashboards that present each data series in its most relevant format.

How to Use It:

  1. Click the currency switcher in the top right of any widget

  2. Select your preferred currency and units for that specific widget

  3. Use the three dot widget menu to duplicate widgets as needed to select price sources in different currencies in the same dashboard

  4. Note that the general unit selector still functions but won't override your customized widgets

Related Features: This update complements other dashboard customization capabilities:

  • Custom dashboard creation

  • Analytical toolbox for cross-commodity comparison

  • One-click correlations checks

  • Exportable charts for reporting

Did you like this update?

LikeNeutralDislike