Vesper has expanded its Meat & Poultry coverage with 249 new price series across three major protein markets: Brazil, Australia, and Thailand. This release adds daily and weekly pricing for beef, poultry, pork, and lamb, strengthening our global protein intelligence for teams sourcing across multiple origins.
What's New:
Brazil: 52 daily price series for chicken, beef, and pork, including 32 entirely new products.
MLA (Australia): 112 weekly saleyard prices for cattle (68 series) and sheep (44 series), based on physical auction transactions. All prices stored on a carcass-weight basis.
Mexmoc (Thailand): 85 weekly price series covering meat, poultry, and related products, including 72 entirely new additions.
Why It Matters: Global protein sourcing requires visibility across multiple origins to compare pricing, validate supplier quotes, and anticipate supply shifts. Brazil, Australia, and Thailand represent critical benchmarks for international meat buyers, yet consistent, structured pricing across these regions has historically been difficult to access in one place. This expansion gives procurement teams the cross-regional view needed to negotiate with confidence and identify cost-saving opportunities.
How to Use It:
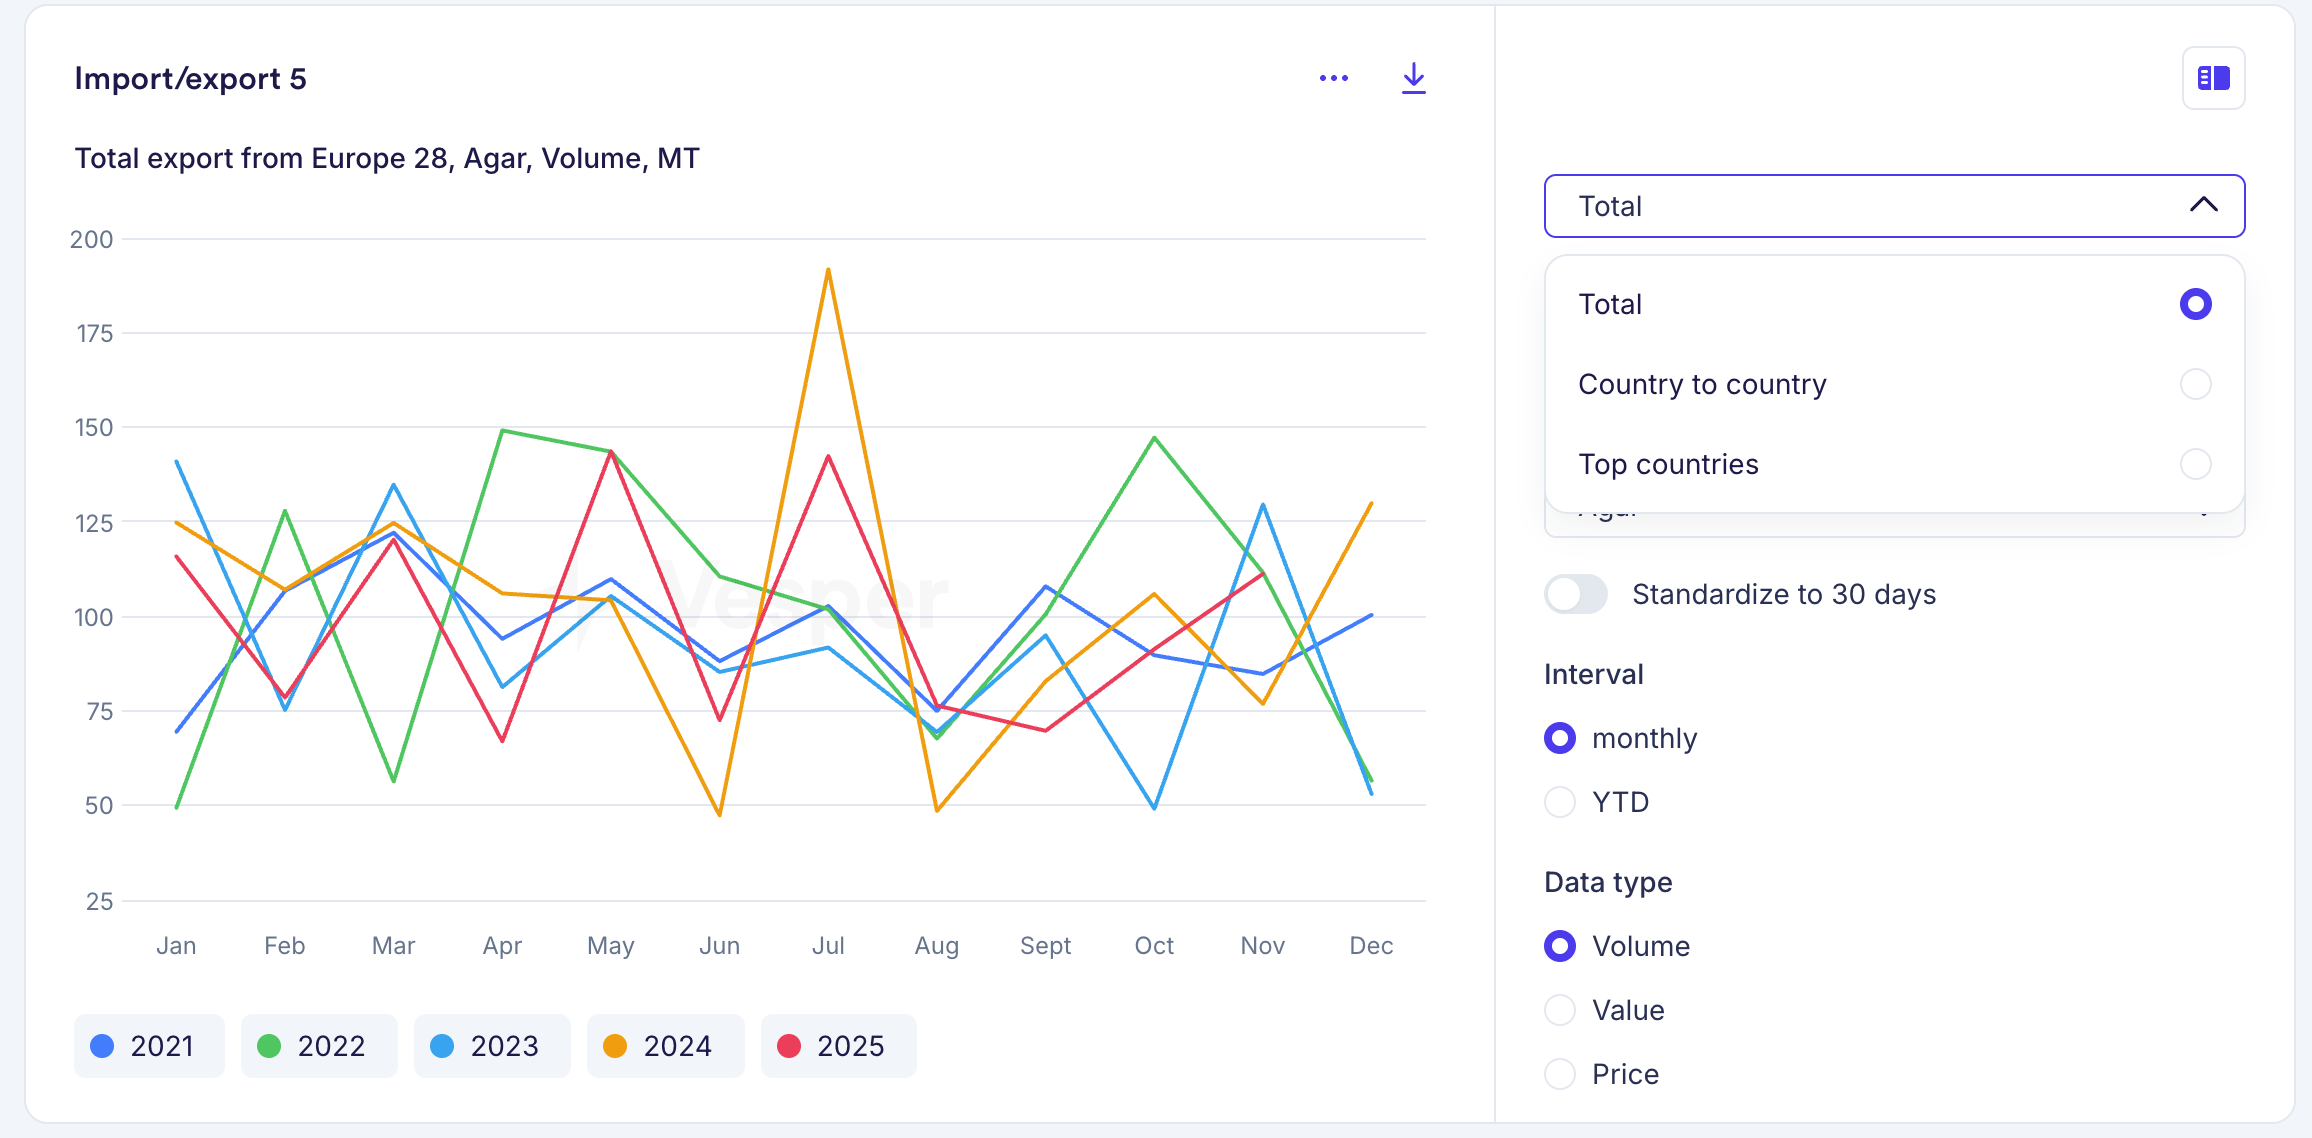
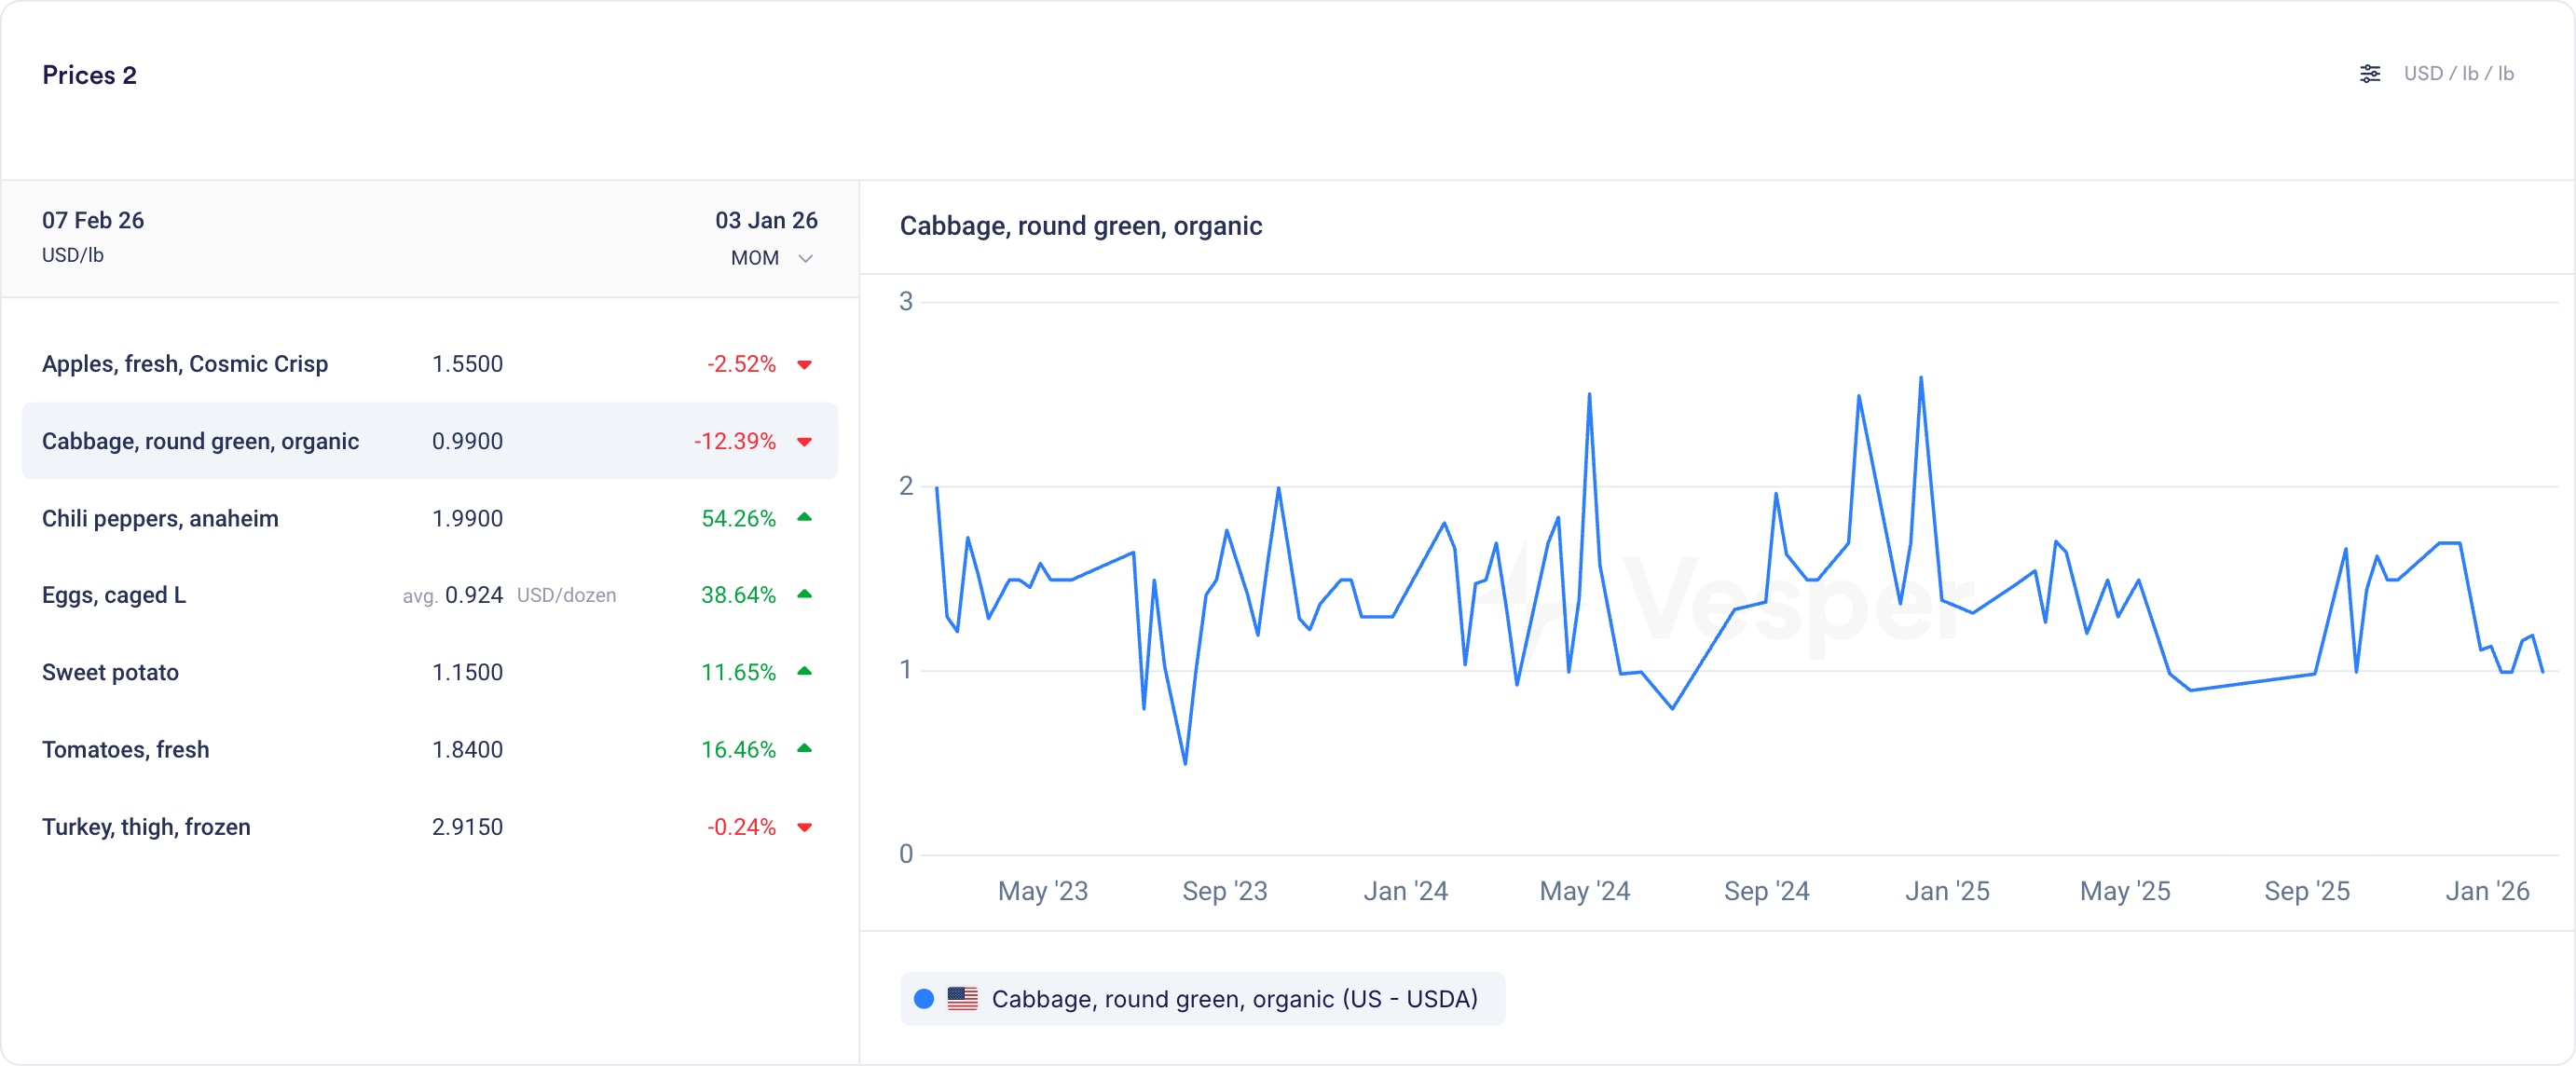
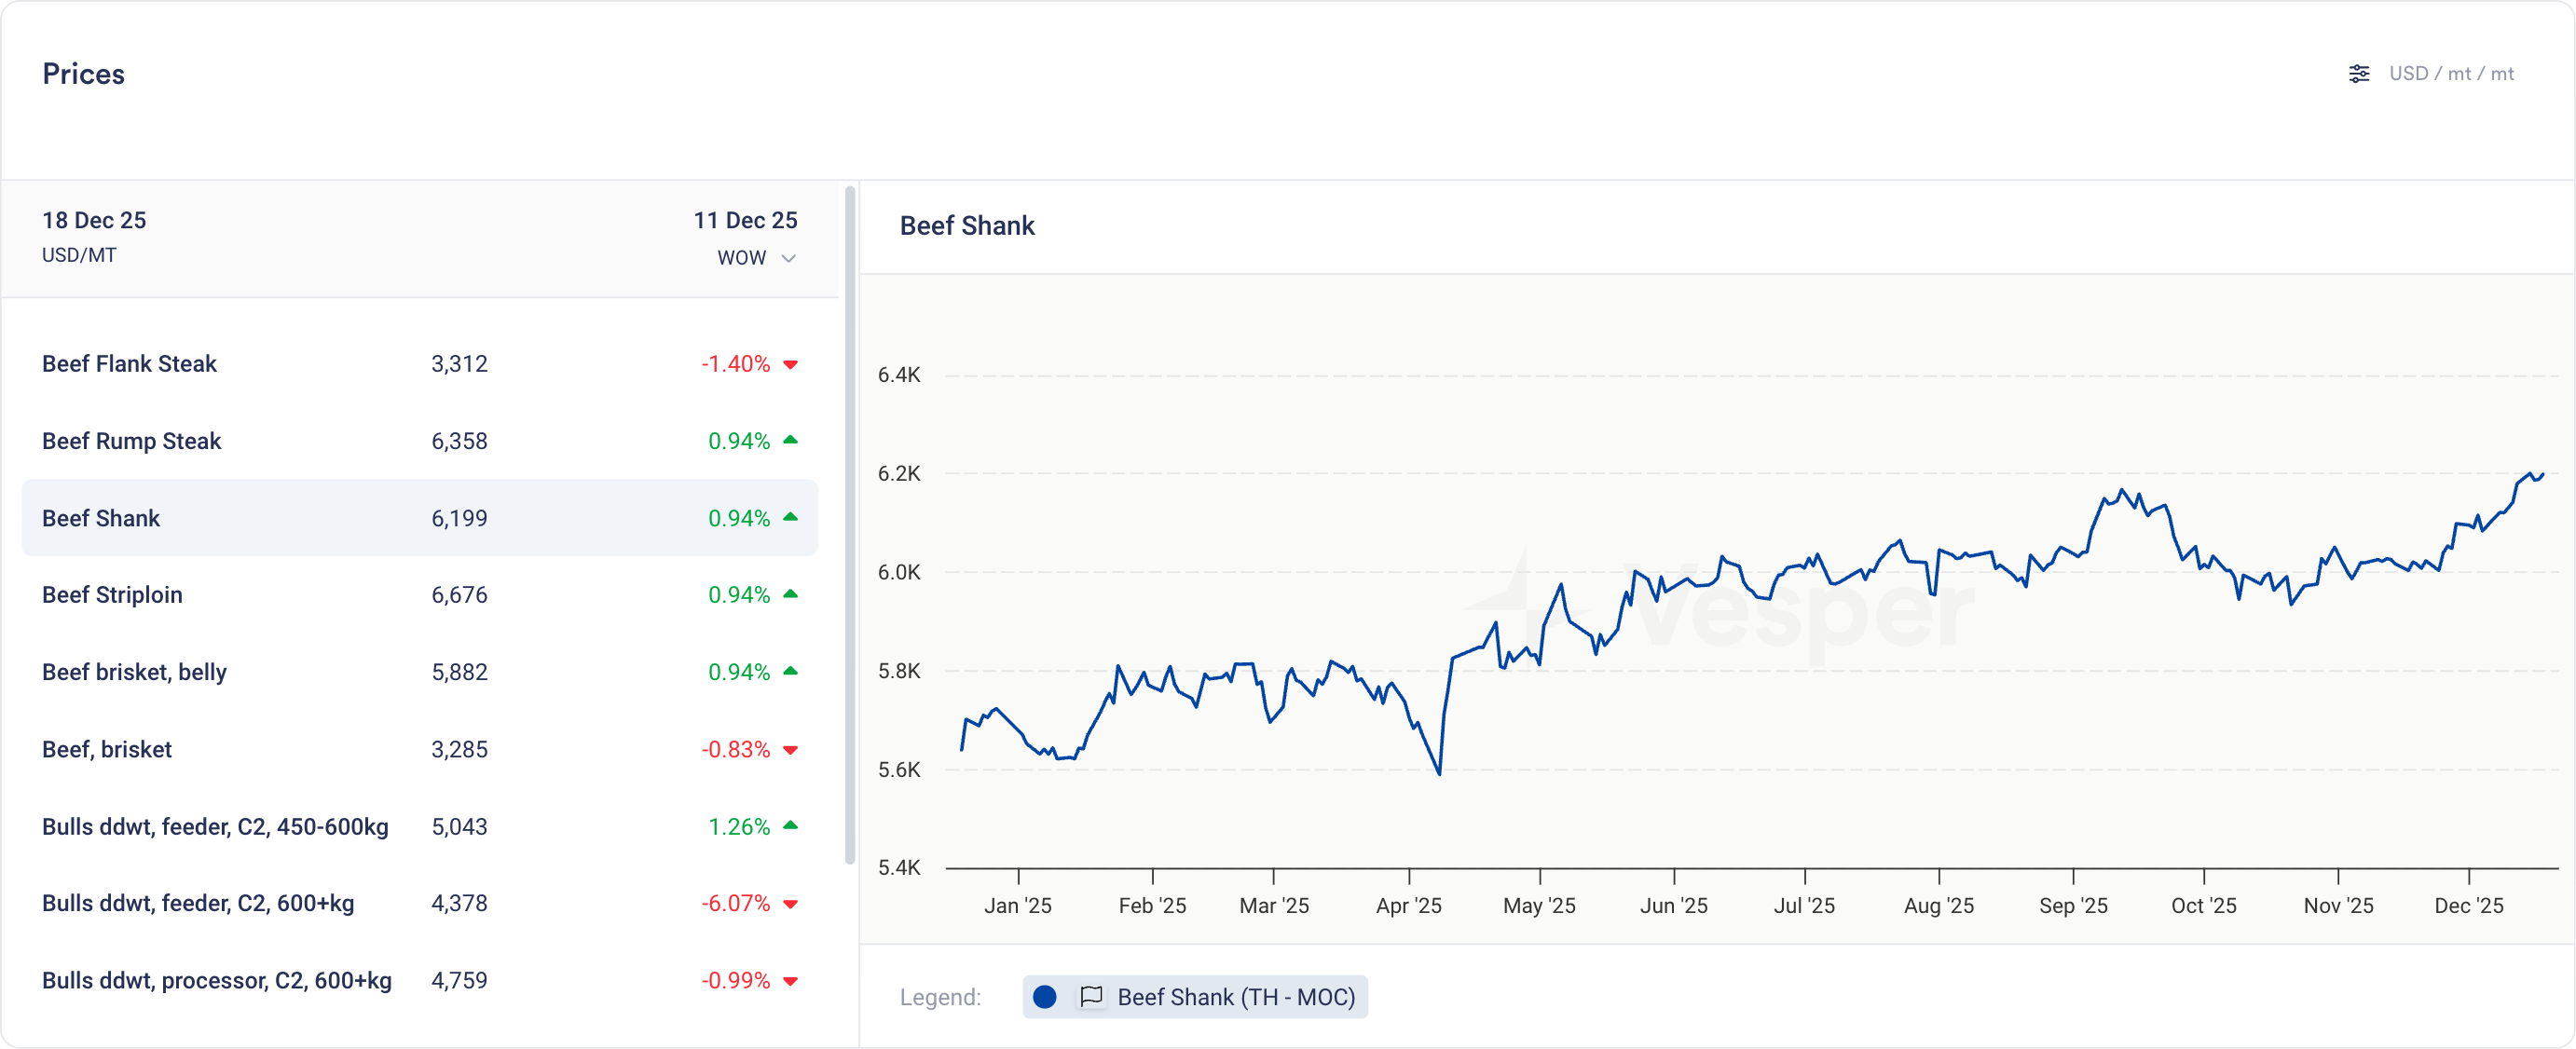
Prices Widget: Bookmark key products (e.g., Brazilian chicken, Australian cattle, Thai pork) for quick access to the latest prices.
Price Comparison: Compare pricing across origins or protein types to spot arbitrage opportunities or validate regional quotes.
Cost Models: Add these series as ingredients in your Cost Models to track input costs for prepared foods, food service menus, or retail protein products.
How to access? Add to new or existing dashboards using the search function, or contact your Customer Success Manager at [email protected] to confirm which specific products are currently active for your region.
Did you like this update?