Vesper  Updates

Vesper for Excel

by Vesper Team, Product Marketing
New
Data
API, Download Data, Excel

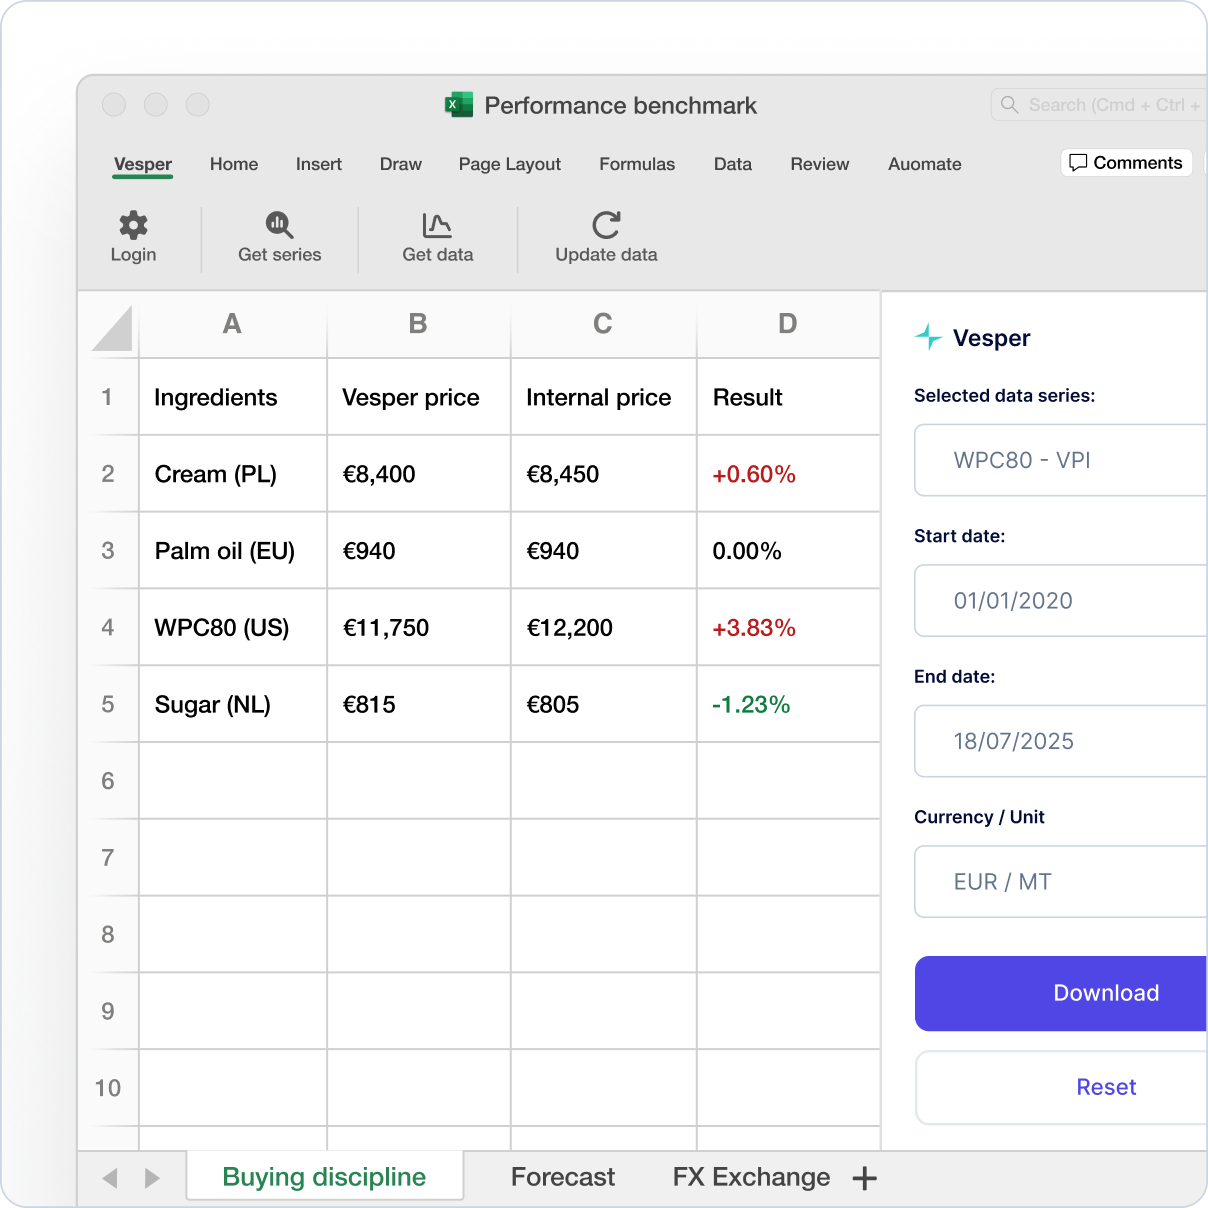
Vesper has launched Vesper for Excel, a powerful new integration that brings Vesper's live commodity intelligence directly into your spreadsheets. This feature eliminates manual data entry, allowing teams to spend less time maintaining spreadsheets and more time analyzing markets with real-time data feeding directly into the models and templates they already use.

What's New:

  • One-Click Refresh: Update all Vesper data in your spreadsheets instantly. With a single click, you can access real-time prices, forecasts, FX rates, and fundamentals.

  • Direct Data Access: Pull data from over 160 global sources directly into any cell in your spreadsheet.

  • Native Integration: Vesper for Excel lives natively within your Excel, integrating seamlessly with your existing workflow and templates.

  • No Coding Required: Perfect for procurement, finance, and sales teams who need live data in spreadsheets without any technical overhead.

Why It Matters: The time spent on manual data collection and entry is time lost on strategic analysis. Vesper for Excel automates this process, ensuring the latest market information always powers your most critical models. It shifts your team's focus from data maintenance to data-driven decision-making.

How to Use It:

  1. Download the add-in from the Microsoft Excel marketplace.

  2. Log in with your Vesper API Excel key.

  3. Set up once by using the Vesper for Excel sidebar to choose the data you need (e.g., commodity, price type, date range).

  4. Click "Refresh" at any time to update all data points in your sheet instantly.

How to access? Reach out to your customer success manager or [email protected] to learn more about the Excel Add-in or the various options to extract or integrate Vesper data directly into your workflows

What data? Vesper for Excel offers seamless access to Vesper's data:

  • Vesper Price Index (VPI)

  • Partner and Public price benchmarks

  • Forecasts for Price, Production, and Stock levels

  • FX rates

  • Global trade data

  • S&D/Fundamental data

  • Stock levels

Learn more

Did you like this update?

LikeNeutralDislike

New: Deselect All Button

by Vesper Team, Product Marketing
Improvement
New
Vesper Toolbox

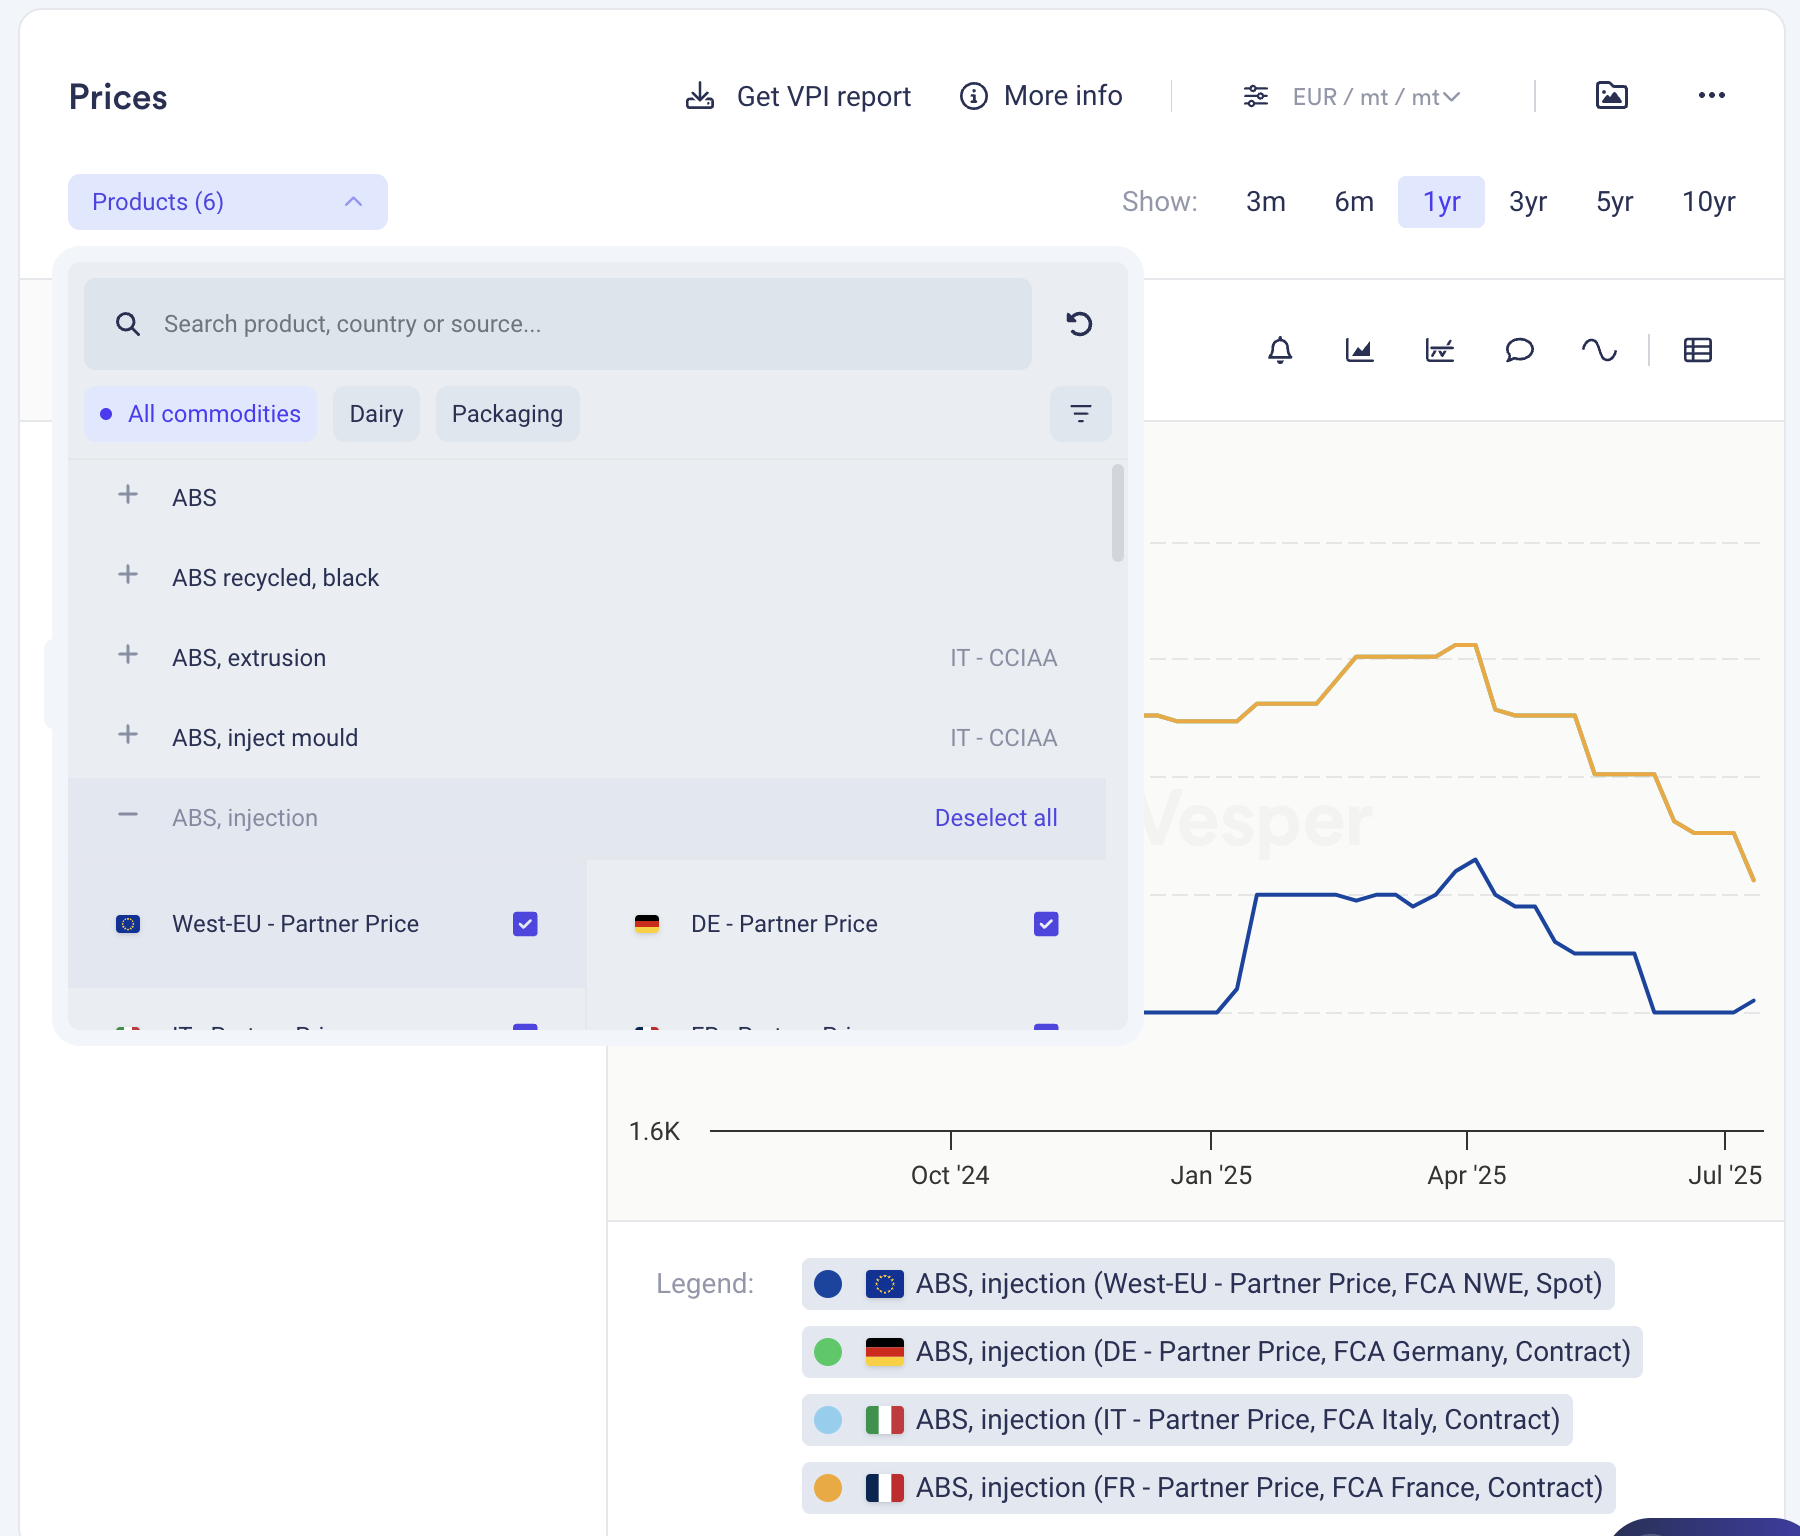
Clear your widget selections instantly with the new "Deselect all" button in dropdown menus. Start fresh analysis without manually removing each selection or dealing with cluttered views.

What it does: One click clears all active selections in a widget What you can do: Reset widgets to empty state for clean analysis Why it matters: Faster workflow, cleaner screens, less clicking

Find it in the dropdown menus across most widgets.

Did you like this update?

LikeNeutralDislike

New Weekly Market Analysis: Coffee Report

by Vesper Team
New
Beverages
Market Analysis

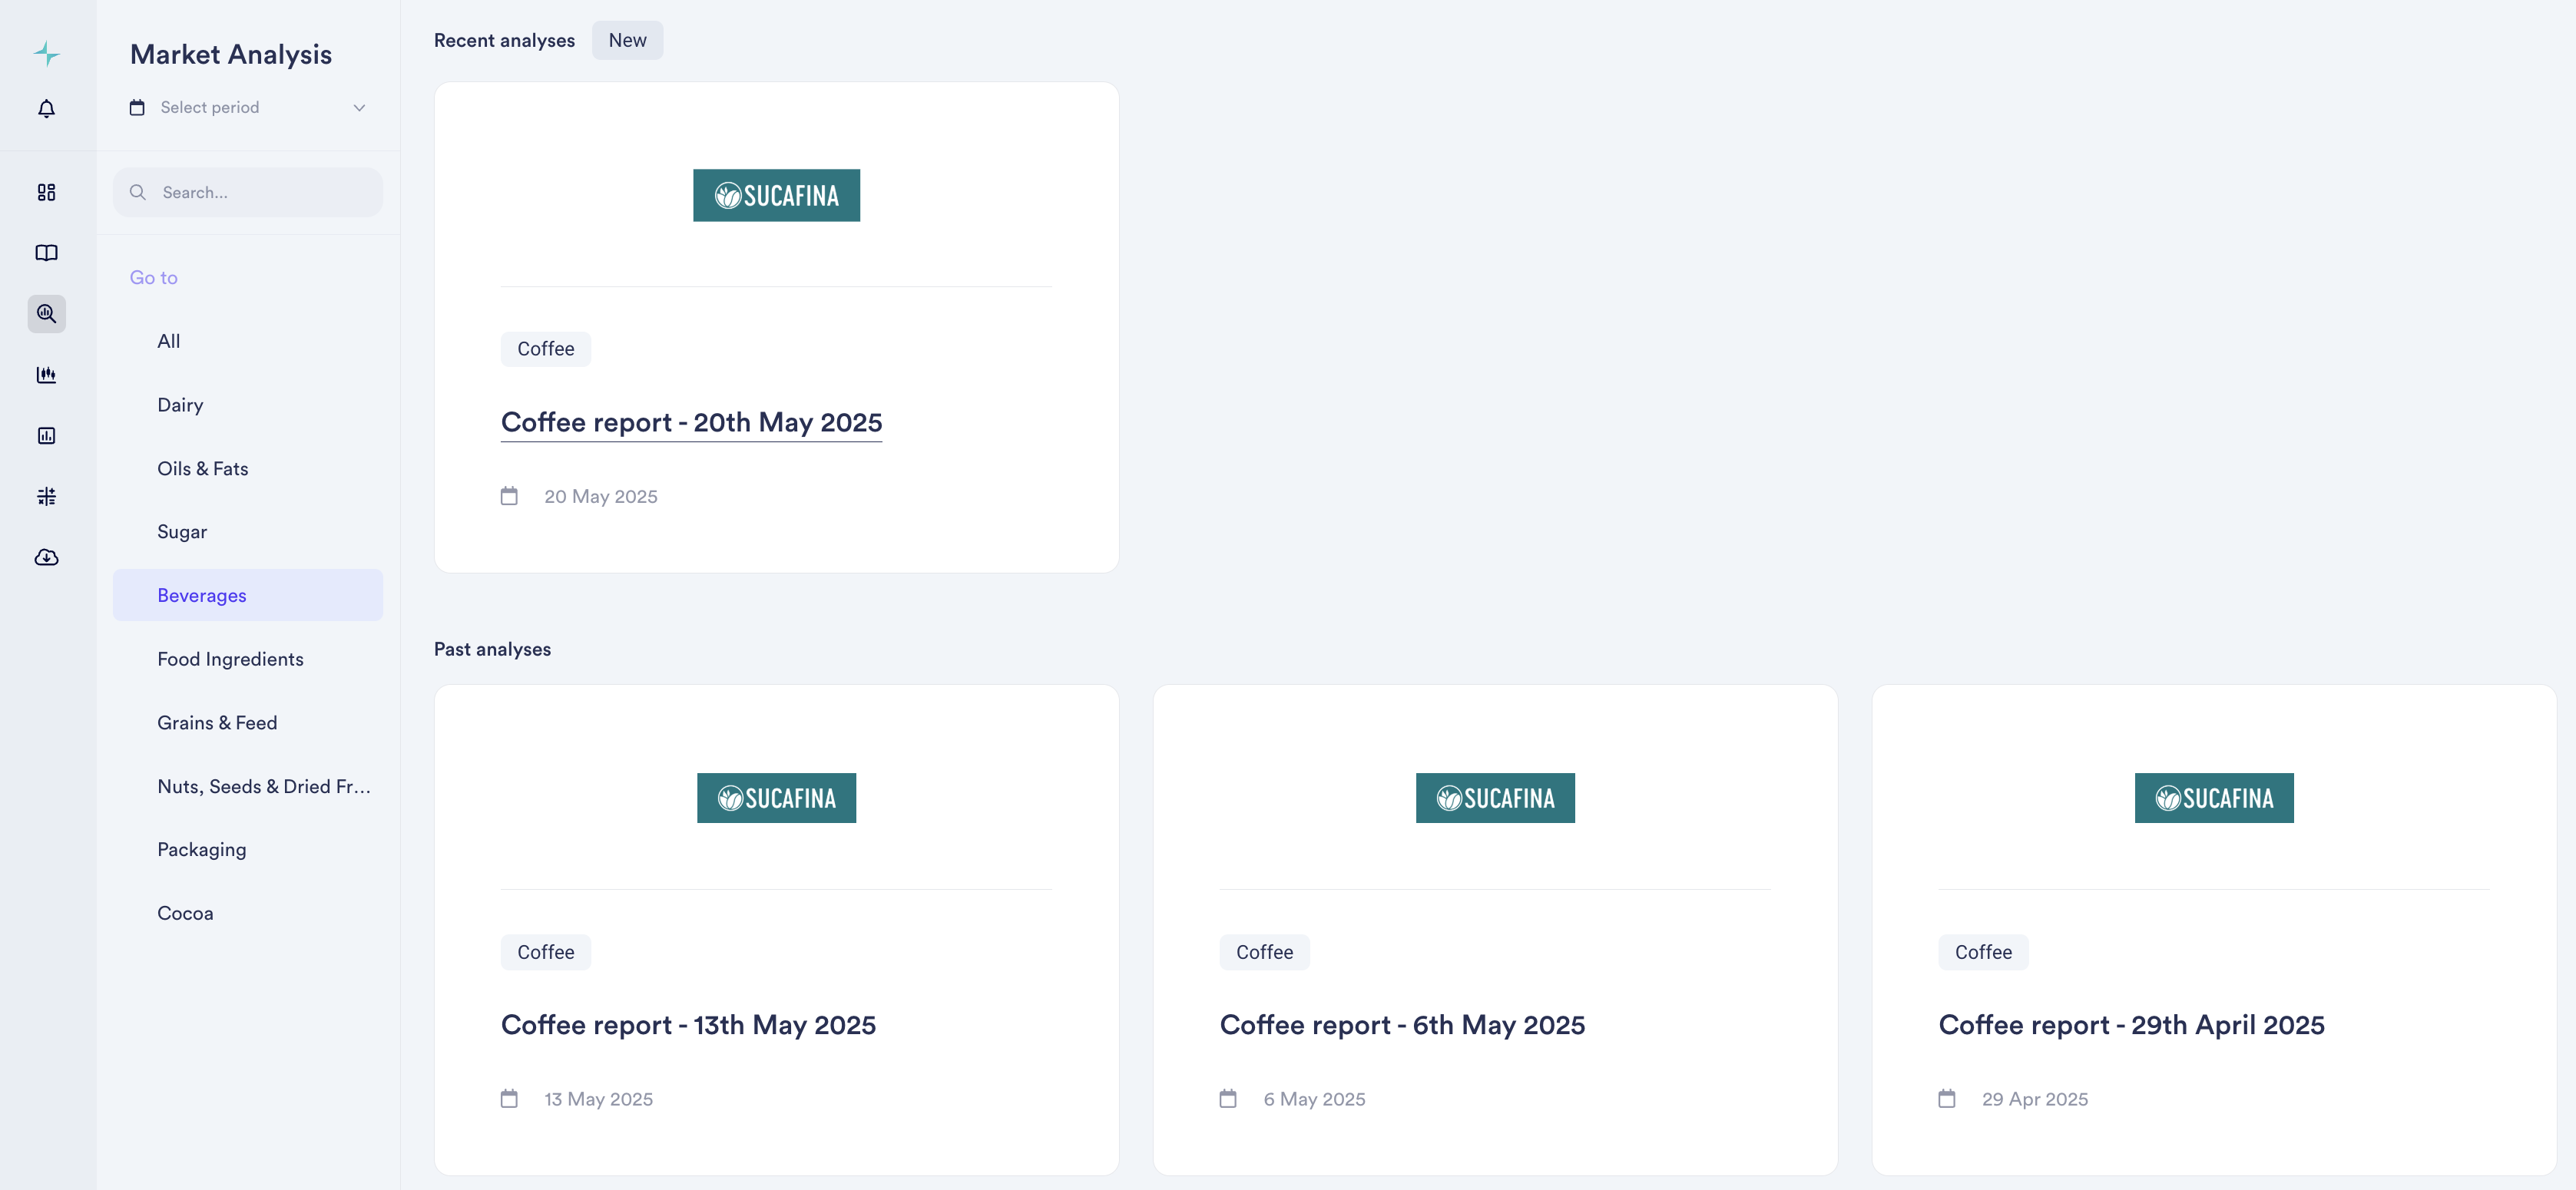
Summary: Vesper is excited to announce the launch of a new weekly market analysis report focused exclusively on coffee. This report, authored by industry leader Sucafina, will provide in-depth insights and timely updates on the global coffee market.

What's New:

  • Dedicated Coffee Market Analysis: A specialized weekly report offering expert analysis of the coffee market.

  • Expert Author: Authored by Sucafina, the leading sustainable Farm to Roaster coffee company with a rich history in commodities since 1905.

  • Frequency: Delivered weekly to keep you informed of the latest market movements.

  • Release Schedule: Available every Tuesday afternoon.

Why It Matters:

Coffee is a critical commodity for many of our users, and this new dedicated report will provide invaluable, focused intelligence. By partnering with Sucafina, we're bringing you expert perspectives and analysis to help you:

  • Understand current market dynamics and trends.

  • Anticipate potential shifts in supply, demand, and pricing.

  • Make more informed purchasing and trading decisions.

  • Gain a deeper understanding of the factors influencing the coffee industry, from farm to roaster.

How to Use It:

  • Access the new Coffee Market Analysis report in the Market Analysis section of the Vesper platform.

  • Look for the report updates every Tuesday afternoon.

  • Consider setting up alerts to be notified when the new report is published.

Read the latest report

Did you like this update?

LikeNeutralDislike

Expanded Cocoa Market Coverage

by Vesper Team
New
Cocoa
Chocolate, Confectionery & Ice Cream
Market Analysis

Launching supplementary bi-weekly cocoa highlights from Vesper's in-house analytical team, complementing the regular market commentary from independent expert Martijn Bron. These additional reports focus on technical analysis, derivative pricing, and weather insights to support decision-making during unprecedented market volatility.

Why it Matters: With cocoa prices at historic highs, procurement teams need comprehensive market coverage. Our in-house analytical team now provides targeted analysis on alternate weeks to Martijn Bron's expert commentary, combining deep technical analysis with veteran market insights during this volatile period.

What's New:

  • Bi-weekly analysis from Vesper's analytical team focusing on:

    • Technical market indicators

    • Derivative pricing trends

    • Weather impact assessment

    • Supply chain disruptions

  • Cocoa coverage schedule:

    • Martijn Bron's expert market commentary

    • Alternating with Vesper's analytical team reports

    • CRA Cocoa weather reports published frequently

How to Use It:

  1. Access Cocoa Highlights in the Market Analysis section on Vesper or the mobile app

  2. Set up notifications to be alerted of any new releases

Read the latest report

Did you like this update?

LikeNeutralDislike

Supply and Demand Map Improvements

by Vesper Team
Improvement
Data

Enhanced S&D Map visualization now provides Year-to-Date (YTD) comparisons across regions, enabling instant visual insights into global production, import/export, and stock trends and regional shifts.

Why it Matters:"If I were interested to see where growth in EU milk production is happening, this would really quickly show me that it is not happening in Ireland, Netherlands or France. It's great for presentations, as not having to click through all countries at the same time makes it ideal for regions or groups of countries."

Jasper Endlich, Dairy Market Analyst

How to Use It:

  1. Find the World Map Widget in the S&D category

  2. Select your metric and timeframe of interest

  3. Compare countries and spot regional trends through color coding

  4. Export directly into presentations or add to your custom dashboards

Did you like this update?

LikeNeutralDislike

Introducing Two New Ways to Find What You Need

by Vesper Team
New
Improvement


We've launched two powerful features to help you navigate the platform more efficiently: Dashboard Search and Vesbot. Each serves a distinct purpose to help you find exactly what you need, when you need it.

What's New

Dashboard Search: Find and Act

Two simple ways to discover available data:

  1. Direct product search

    • Search for specific products (e.g., "WPI", "Sugar", "Cocoa")

    • See all available data types for that product

    • Add relevant data directly to your dashboards

  2. Category navigation

    • Browse through product categories

    • Select product within the category

    • Explore available data types

Both paths help you discover and organize the data you need in your dashboards.

Vesbot: Ask and Learn

  • Get instant answers about platform features

  • Learn how to use specific platform capabilities

  • Access platform support 24/7

  • Available through the help icon in the bottom right corner

Why It Matters

Finding the right data and understanding how to use it are crucial for making timely decisions. Dashboard Search helps you quickly locate and organize market data, while Vesbot ensures you can instantly learn how to use platform features effectively.

When To Use Which?

How to Use It

Dashboard Search

  1. Click the search bar above your workspaces

  2. Enter what you're looking for (e.g., "WPI prices")

  3. Add Country/region

  4. Add relevant data directly to your dashboards or create a new one

Vesbot

  1. Click the help icon in the bottom right corner

  2. Type your question (e.g., "How do I compare prices between regions?")

  3. Get immediate answers and guidance

  4. Follow up with additional questions if needed

  5. Left with questions? Our Support team is still available to help, just ask Vesbot to connect you.

Did you like this update?

LikeNeutralDislike

New Weekly Coffee Market Report

by Vesper Team
New
Beverages
Market Analysis

Summary: New weekly coffee market analysis covering Vietnam, Indonesia, Brazil, and China, providing insights into production trends and market dynamics.

What's New:

  • Weekly coffee market reports

  • Coverage of key producing regions

  • Production trend analysis

  • Market dynamics insights

  • Price movement tracking

Why It Matters: Understanding coffee production and market trends is essential for analyzing global supply dynamics and their impact on market prices. This report gives you a head start on coffee market intelligence ahead of planned expansions in 2025

How to Use It:

  1. Navigate to Market Analysis section

  2. Select Beverages category

  3. Find the latest coffee report under Weekly Updates

Use Case Example: Coffee roasters and beverage companies can use these insights to track production trends across major growing regions and anticipate potential market shifts.

Read the latest report

Did you like this update?

LikeNeutralDislike

Cocoa Market Fundamentals: Production & Import/Export

by Vesper Team
New
Cocoa
Chocolate, Confectionery & Ice Cream

Summary: Cocoa production data from 8 major producing countries and import/export data for key products and derivatives added to bring more transparency to the cocoa supply chain amidst record volatility.

What's New:

  • Production volumes from:

    • West Africa: Ivory Coast, Ghana, Cameroon, Nigeria

    • Latin America: Brazil, Ecuador

    • Asia Pacific: Indonesia, Papua New Guinea

  • Global trade flow data for:

    • Cocoa beans

    • Cocoa powder, butter, and mass

    • Chocolate products

Why It Matters: Production volumes from major origins like Ivory Coast and Ghana often indicate future price movements. Combined with trade flow data, you can better anticipate market shifts and understand the influence of fundamental drivers on market dynamics.

How to Use It:

  1. Find production data in your Production widget

  2. Access trade flows through the Import/Export widgets (Pro tip: % Change and YTD figures can be found in dropdown)

  3. Filter by country or product as needed

Don't have access to Cocoa yet?Contact the Vesper Team

Did you like this update?

LikeNeutralDislike

New Cocoa Ratios Table: Track Product Values Daily πŸ“Š

by Vesper Team
New
Cocoa
Chocolate, Confectionery & Ice Cream

Summary: New Cocoa Ratios Table tracks daily cocoa bean prices, regional premiums, and butter/powder ratios, helping you understand product value correlations.

What's New:

  • Daily updated view of:

    • Cocoa bean prices by origin

    • Butter and powder ratios

    • Regional premiums

    • ICE futures prices

  • Updates after ICE EU market close

Why It Matters: Cocoa butter and powder prices move independently based on market demand. This table helps you track these movements and their impact on product costs, critical for sourcing decisions.

How to Use It:

  1. Navigate to the Cocoa section

  2. Open the Ratios Table widget

  3. Compare ratios across products and regions

Don’t have access yet?Reach out to the Vesper Team

Did you like this update?

LikeNeutralDislike