Vesper  Updates

New: Deselect All Button

by Vesper Team, Product Marketing
Improvement
New
Vesper Toolbox

Clear your widget selections instantly with the new "Deselect all" button in dropdown menus. Start fresh analysis without manually removing each selection or dealing with cluttered views.

What it does: One click clears all active selections in a widget What you can do: Reset widgets to empty state for clean analysis Why it matters: Faster workflow, cleaner screens, less clicking

Find it in the dropdown menus across most widgets.

Did you like this update?

LikeNeutralDislike

300 new Beef, Pork, and Lamb Prices

by Vesper Team
New
Data
Food Manufacturing
Meat & Poultry

What's New

  • 300 new daily price series covering major beef, pork, and lamb products

  • Real-time daily updates to ensure you have the latest market data

  • Coverage across different cuts, grades, and products

How to use in Vesper:
Prices Widget

  • Easily track and monitor daily price movements for all meat categories

  • Quick access to historical trends and current market conditions

  • Ideal widget for efficient price monitoring

Cost Models

  • Incorporate new meat price data into custom recipe breakdowns

  • Build cost models that reflect your product’s market pricing

  • Create detailed analyses for food service, retail, and manufacturing applications

Price Comparison

  • Compare meat prices against other commodity products

  • Identify correlations and patterns between different protein markets

Getting Started

The new meat price series are immediately to users with Meats&Poultry in their commodity package. To begin using this data:

  1. Use the Prices Widget to explore individual price series

  2. Use the Price Comparison to analyze relationships between meat and other commodities

  3. Access Cost Models to incorporate the new data into your custom analyses

Questions or Support

For questions about the new meat price series or assistance with implementation, please contact our support team at: [email protected]

Did you like this update?

LikeNeutralDislike

Cost Models: Turn commodity benchmarks into product pricing

by Vesper Team
New
Food Manufacturing
Retail
Cost Models

Summary: Vesper has launched Cost Models, a powerful new feature that transforms individual commodity benchmarks into complete product cost insights. This capability allows food manufacturers to combine weighted commodity benchmarks with standardized non-ingredient costs to build accurate product pricing models, delivering unprecedented visibility into true product economics.

What's New:

  • Build complete product cost models by combining multiple commodity benchmarks with precise weightings

  • Access industry-standard non-ingredient costs (labor, manufacturing, overhead) specific to your region

  • Choose from our template library for common food products or create custom models

  • Track how each component contributes to your total product cost with automatic updates whenever source prices change

Why It Matters: With record-high volatility across food commodities, understanding how ingredient changes impact finished products is critical for maintaining margins. Cost Models provide complete cost structure visibility for your entire organization: procurement teams can verify supplier price increases, finance can track margin impacts across product portfolios, and sales teams can justify price adjustments to customers with independently verified data. Non-ingredient costs can represent up to 47% of total product costs—a critical component that's now visible alongside your commodity benchmarks.

How to Use It:

  1. Access Cost Models through the main dashboard menu

  2. Choose between starting with a template or building a model from scratch

  3. Select ingredients from your available commodities and assign precise weightings

  4. Add country-specific non-ingredient costs by selecting your industry and location

  5. Save your model to track cost evolution over time as prices update automatically

Related Features: Cost Models integrates seamlessly with Vesper's existing capabilities:

  • Individual commodity price benchmarks (VPI, Partner prices, and Public benchmarks found in prices widgets)

  • Incorporate into your own custom dashboards

  • Coming in Q3 2025: Forecasting capabilities for your cost models

Did you like this update?

LikeNeutralDislike

European Energy Futures

by Vesper Team
New
Energy & Transport
Data

Summary: Vesper has significantly expanded our European electricity futures coverage with the addition of comprehensive EEX data across 15 countries. This enhancement delivers detailed visibility into power markets throughout Europe, covering both base and peak load contracts across monthly, quarterly, and yearly timeframes.

What's New:

  • 86 new electricity futures contracts covering:

    • 15 European countries including Germany, France, UK, Italy, Spain, and more

    • Base and peak load power contracts

    • Monthly, quarterly, and yearly delivery periods

  • Available across multiple widgets including:

    • Futures widgets (Graph, Table, Historical Settle Graph)

    • Price & Price Comparison widget

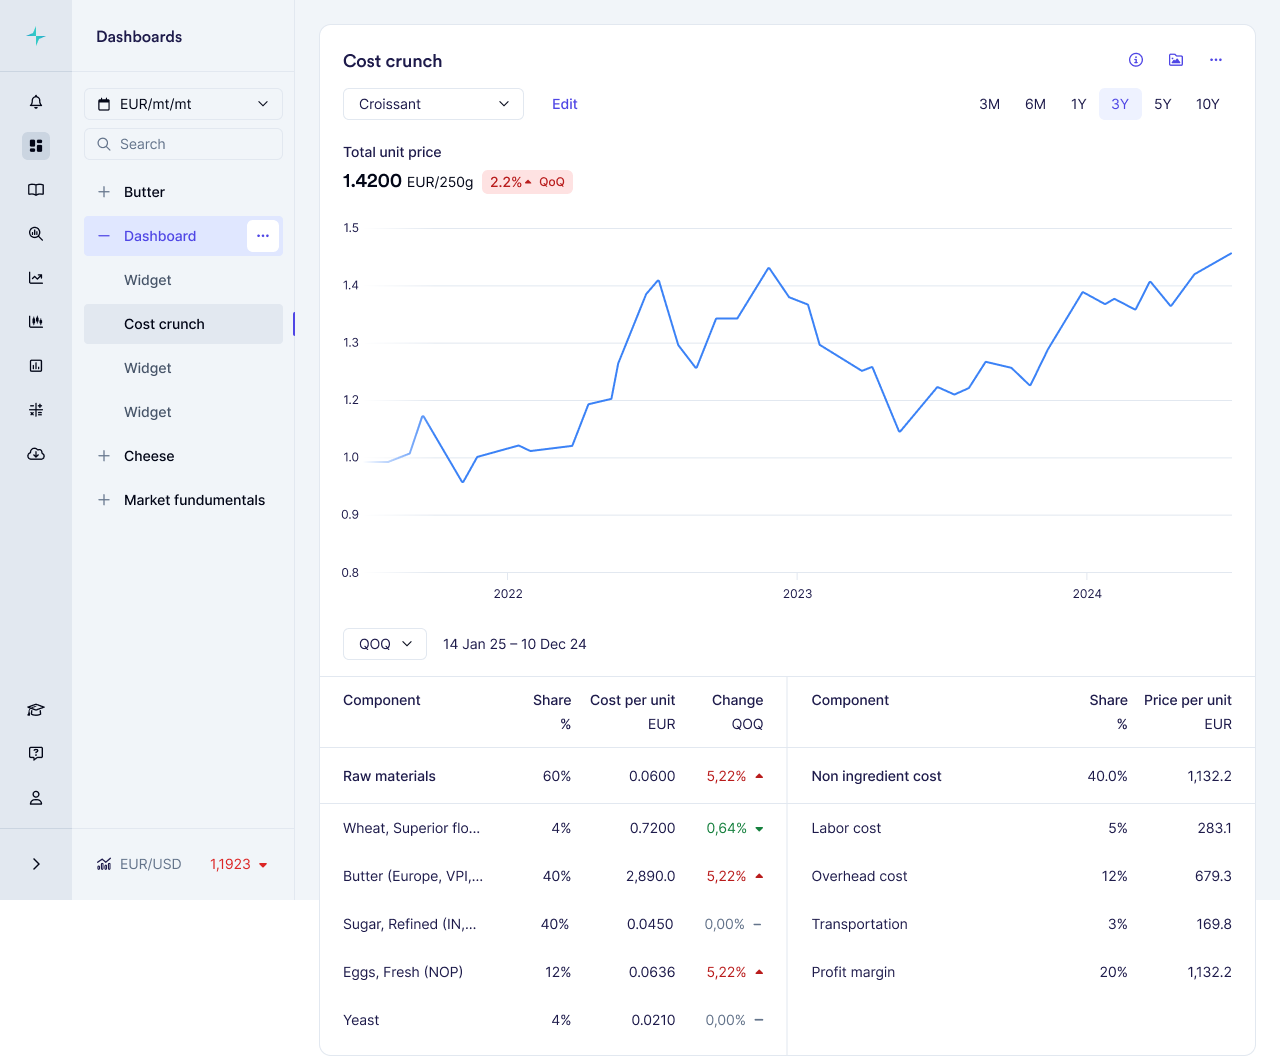
Why It Matters: Energy costs represent a significant component of manufacturing expenses. With this expanded coverage, users can monitor electricity futures across their operational footprint, compare price trends between regions, and develop more effective energy procurement strategies based on forward market indicators.

How to Use It:

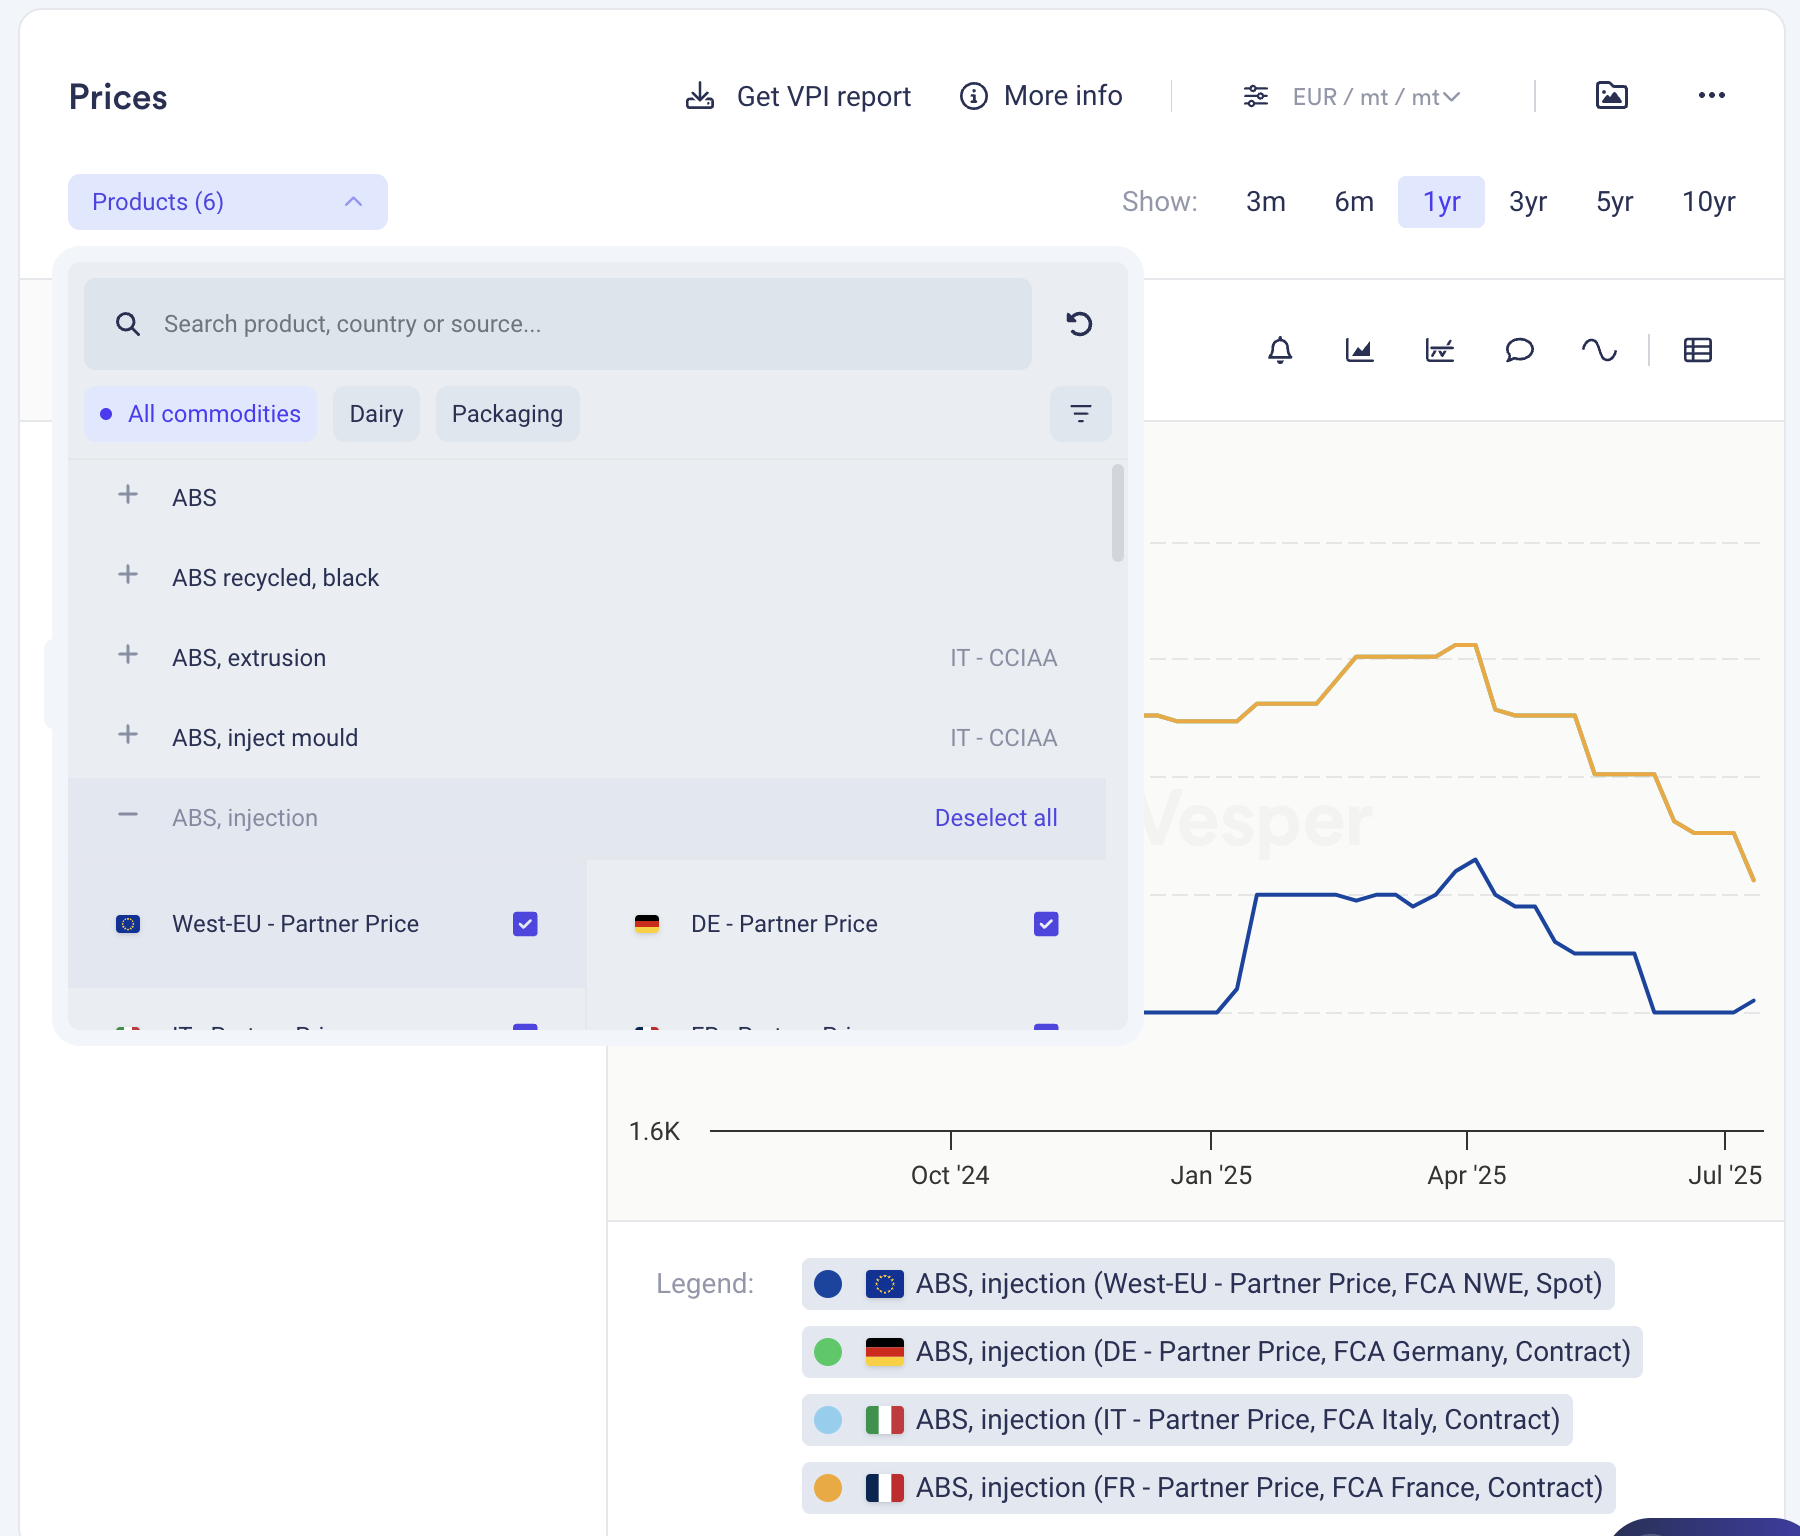
  1. Access these new products through any of the supported widgets

  2. Search by country name and contract type (e.g., "German Power Base")

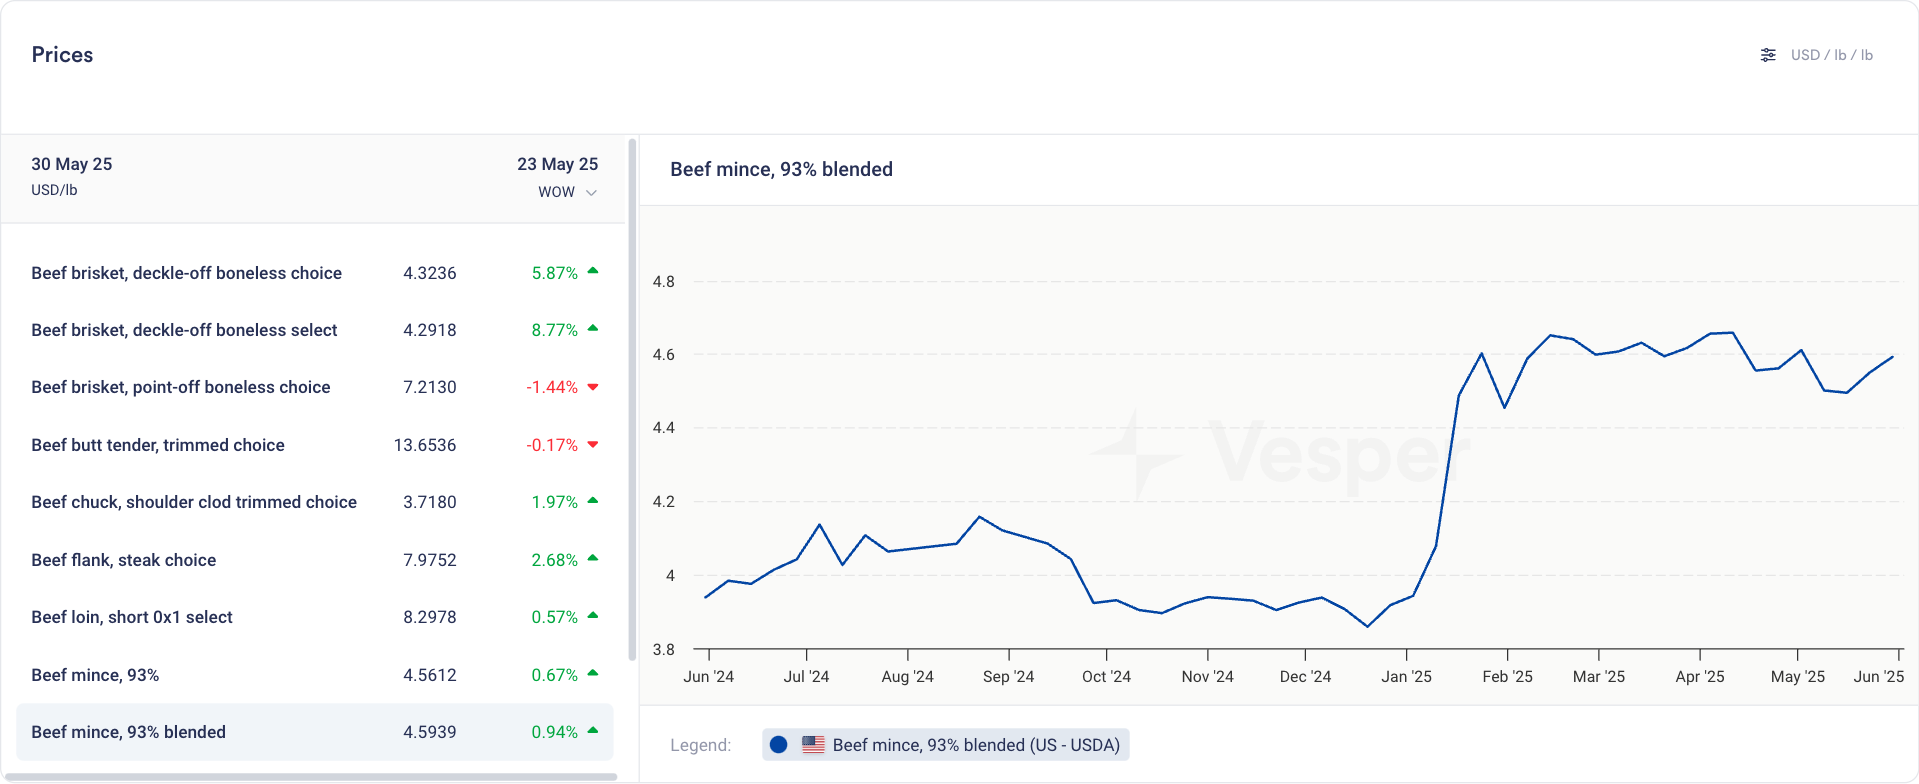
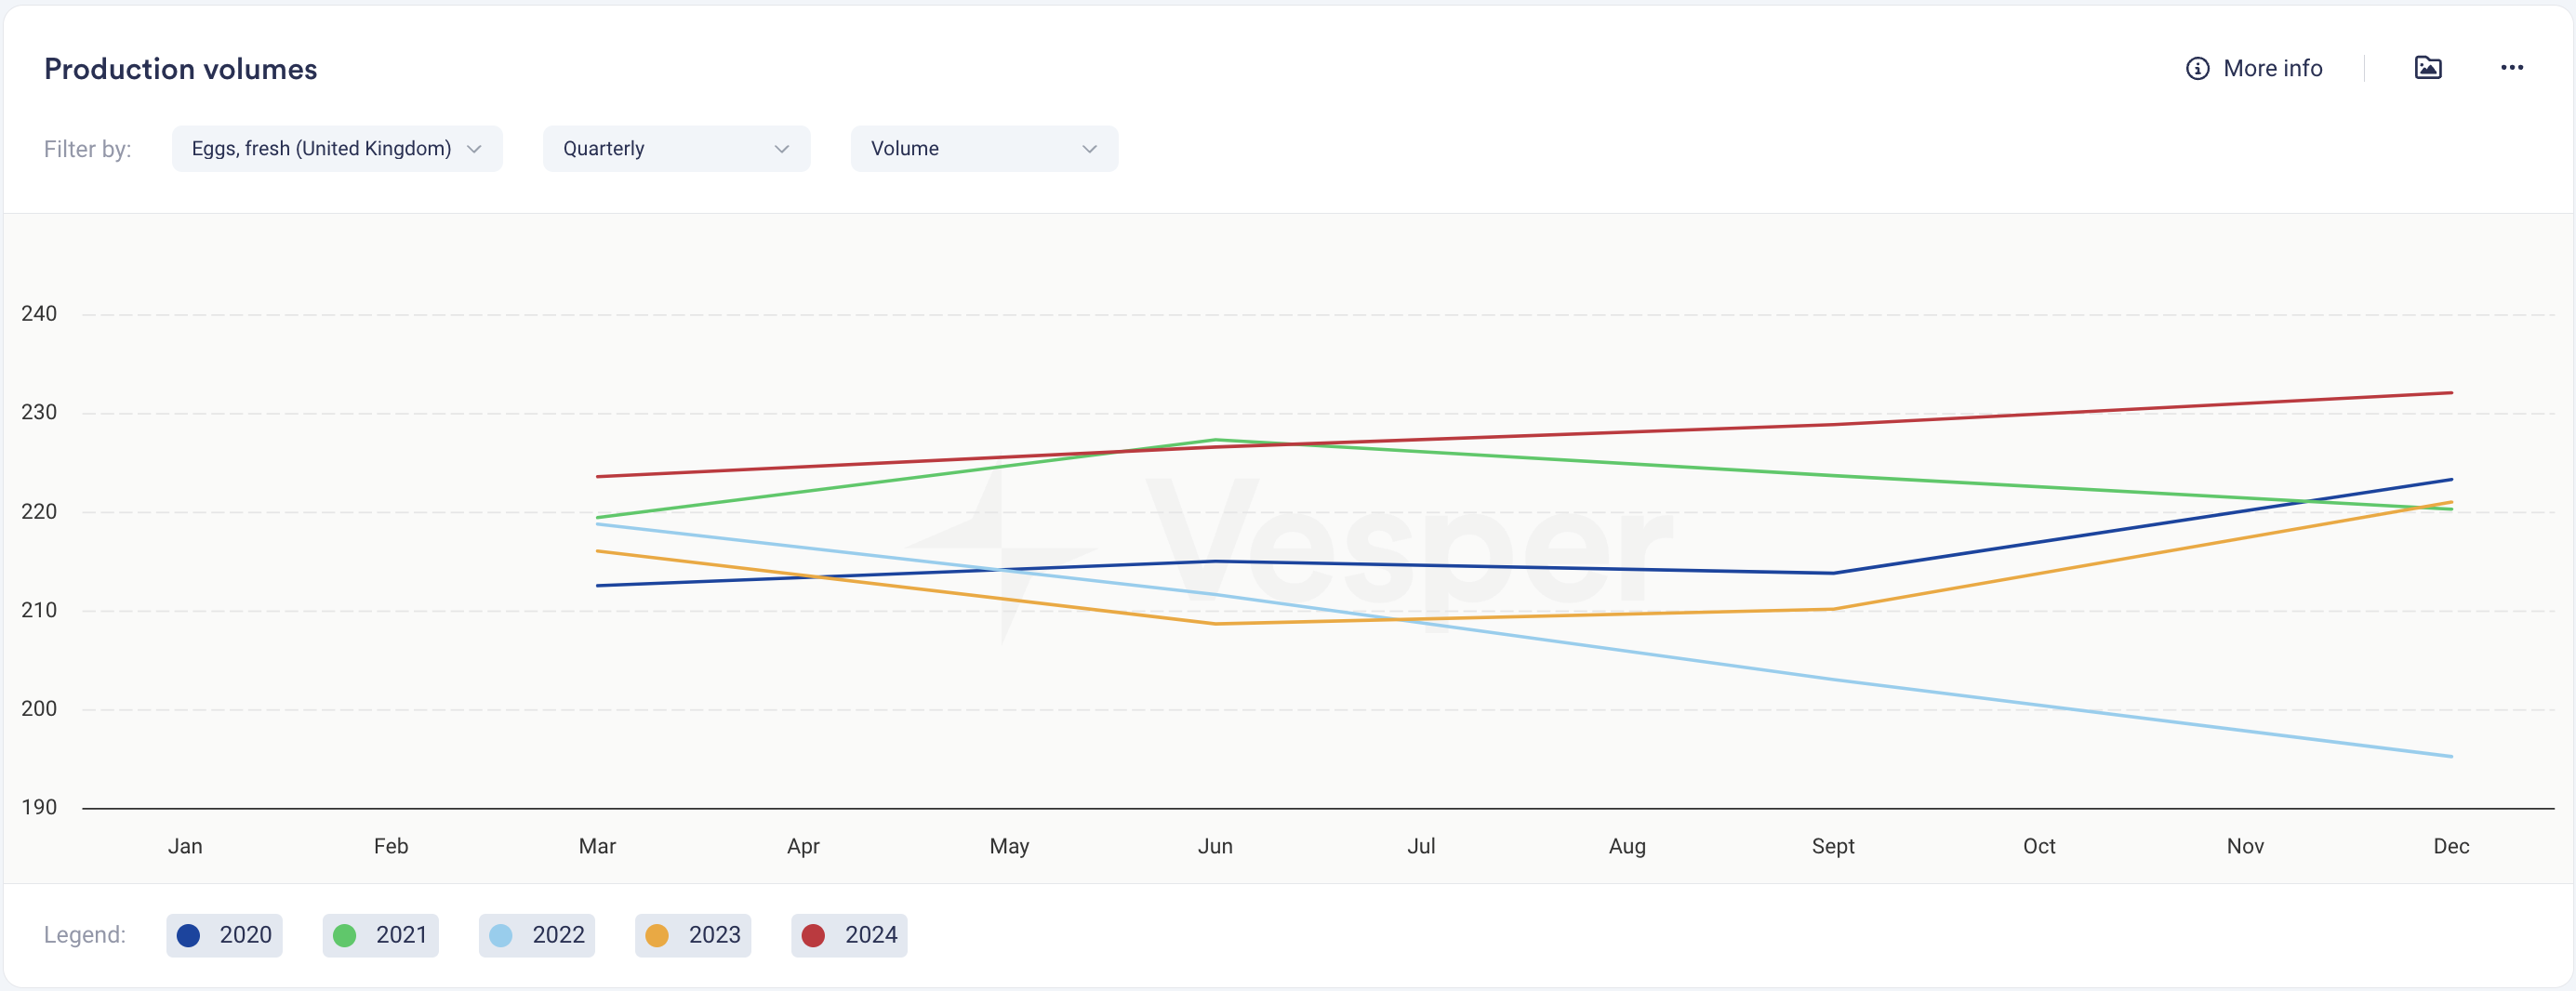
  3. Compare electricity futures across different European markets

  4. Track forward curves to inform energy procurement decisions & Market outlook

Related Features: This expansion complements our existing energy market coverage:

  • Natural gas futures across major European hubs

Did you like this update?

LikeNeutralDislike

UK Egg Production Data Now Live

by Vesper Team
New
Data
Bakery
Food Ingredients
Sauces & Condiments

Summary: Vesper has expanded our egg market coverage by integrating official quarterly UK egg production data. This enhancement provides critical supply information to complement our existing egg price benchmarks, delivering deeper market insights for procurement teams in a category known for significant volatility.

What's New:

  • Quarterly UK egg production data from official government sources covering:

    • Eggs, Fresh

    • Egg Enriched Derivatives, Caged

    • Eggs, Free Range

  • Reporting:

    • Production volumes across different egg types

    • Quarter-over-quarter production trends

    • Year-over-year production comparisons

Why It Matters: Egg markets have been extremely volatile, mainly due to supply side constraints caused by HPAI recently. With production levels directly impacting price movements. This new production data helps procurement teams anticipate market shifts by tracking supply dynamics, providing essential context for buying decisions and supplier negotiations in a challenging category.

How to Use It:

  1. Navigate to the production widget in your dashboard

  2. Select the relevant product in the dropdown

  3. View production trends quarterly or evolutions compared to the prior years

Related Features: This update complements our comprehensive egg market coverage:

  • Vesper Price Index (VPI) for 16 egg products across different production systems

  • Expert market analysis for the egg sector

  • Global news feed specific to eggs and poultry

  • Price benchmarks across caged, barn, and free-range production systems

Did you like this update?

LikeNeutralDislike

Expanded Cocoa Market Coverage

by Vesper Team
New
Cocoa
Chocolate, Confectionery & Ice Cream
Market Analysis

Launching supplementary bi-weekly cocoa highlights from Vesper's in-house analytical team, complementing the regular market commentary from independent expert Martijn Bron. These additional reports focus on technical analysis, derivative pricing, and weather insights to support decision-making during unprecedented market volatility.

Why it Matters: With cocoa prices at historic highs, procurement teams need comprehensive market coverage. Our in-house analytical team now provides targeted analysis on alternate weeks to Martijn Bron's expert commentary, combining deep technical analysis with veteran market insights during this volatile period.

What's New:

  • Bi-weekly analysis from Vesper's analytical team focusing on:

    • Technical market indicators

    • Derivative pricing trends

    • Weather impact assessment

    • Supply chain disruptions

  • Cocoa coverage schedule:

    • Martijn Bron's expert market commentary

    • Alternating with Vesper's analytical team reports

    • CRA Cocoa weather reports published frequently

How to Use It:

  1. Access Cocoa Highlights in the Market Analysis section on Vesper or the mobile app

  2. Set up notifications to be alerted of any new releases

Read the latest report

Did you like this update?

LikeNeutralDislike

Supply and Demand Map Improvements

by Vesper Team
Improvement
Data

Enhanced S&D Map visualization now provides Year-to-Date (YTD) comparisons across regions, enabling instant visual insights into global production, import/export, and stock trends and regional shifts.

Why it Matters:"If I were interested to see where growth in EU milk production is happening, this would really quickly show me that it is not happening in Ireland, Netherlands or France. It's great for presentations, as not having to click through all countries at the same time makes it ideal for regions or groups of countries."

Jasper Endlich, Dairy Market Analyst

How to Use It:

  1. Find the World Map Widget in the S&D category

  2. Select your metric and timeframe of interest

  3. Compare countries and spot regional trends through color coding

  4. Export directly into presentations or add to your custom dashboards

Did you like this update?

LikeNeutralDislike

Introducing Two New Ways to Find What You Need

by Vesper Team
New
Improvement


We've launched two powerful features to help you navigate the platform more efficiently: Dashboard Search and Vesbot. Each serves a distinct purpose to help you find exactly what you need, when you need it.

What's New

Dashboard Search: Find and Act

Two simple ways to discover available data:

  1. Direct product search

    • Search for specific products (e.g., "WPI", "Sugar", "Cocoa")

    • See all available data types for that product

    • Add relevant data directly to your dashboards

  2. Category navigation

    • Browse through product categories

    • Select product within the category

    • Explore available data types

Both paths help you discover and organize the data you need in your dashboards.

Vesbot: Ask and Learn

  • Get instant answers about platform features

  • Learn how to use specific platform capabilities

  • Access platform support 24/7

  • Available through the help icon in the bottom right corner

Why It Matters

Finding the right data and understanding how to use it are crucial for making timely decisions. Dashboard Search helps you quickly locate and organize market data, while Vesbot ensures you can instantly learn how to use platform features effectively.

When To Use Which?

How to Use It

Dashboard Search

  1. Click the search bar above your workspaces

  2. Enter what you're looking for (e.g., "WPI prices")

  3. Add Country/region

  4. Add relevant data directly to your dashboards or create a new one

Vesbot

  1. Click the help icon in the bottom right corner

  2. Type your question (e.g., "How do I compare prices between regions?")

  3. Get immediate answers and guidance

  4. Follow up with additional questions if needed

  5. Left with questions? Our Support team is still available to help, just ask Vesbot to connect you.

Did you like this update?

LikeNeutralDislike

Cocoa Market Fundamentals: Production & Import/Export

by Vesper Team
New
Cocoa
Chocolate, Confectionery & Ice Cream

Summary: Cocoa production data from 8 major producing countries and import/export data for key products and derivatives added to bring more transparency to the cocoa supply chain amidst record volatility.

What's New:

  • Production volumes from:

    • West Africa: Ivory Coast, Ghana, Cameroon, Nigeria

    • Latin America: Brazil, Ecuador

    • Asia Pacific: Indonesia, Papua New Guinea

  • Global trade flow data for:

    • Cocoa beans

    • Cocoa powder, butter, and mass

    • Chocolate products

Why It Matters: Production volumes from major origins like Ivory Coast and Ghana often indicate future price movements. Combined with trade flow data, you can better anticipate market shifts and understand the influence of fundamental drivers on market dynamics.

How to Use It:

  1. Find production data in your Production widget

  2. Access trade flows through the Import/Export widgets (Pro tip: % Change and YTD figures can be found in dropdown)

  3. Filter by country or product as needed

Don't have access to Cocoa yet?Contact the Vesper Team

Did you like this update?

LikeNeutralDislike