Vesper  Updates

New: Deselect All Button

by Vesper Team, Product Marketing
Improvement
New
Vesper Toolbox

Clear your widget selections instantly with the new "Deselect all" button in dropdown menus. Start fresh analysis without manually removing each selection or dealing with cluttered views.

What it does: One click clears all active selections in a widget What you can do: Reset widgets to empty state for clean analysis Why it matters: Faster workflow, cleaner screens, less clicking

Find it in the dropdown menus across most widgets.

Did you like this update?

LikeNeutralDislike

Technical Analysis: Interpretable and actionable for all food commodity products

by Vesper Team
New
Vesper Toolbox
Forecasting & Outlook

Summary: Vesper has launched Technical Analysis, a new forward-looking capability that translates complex market behavior into clear, actionable timing signals. Previously reserved for trading experts using specialized tools, technical analysis is now accessible to every procurement professional through simple, visual indicators. This feature helps teams identify optimal buying windows by analyzing price patterns and momentum, delivering straightforward signals that answer the critical question: "When should I act?"—no financial expertise required.

What's New:

  • Three procurement-focused indicators that signal market timing without financial jargon

  • Moving Averages show if prices are trending above or below "normal" levels

  • MACD detects when price movements are accelerating or losing steam

  • RSI identifies when markets are overheated or oversold, highlighting potential reversals

  • Clean visual signals (green/red arrows + Interpreted text) that make complex analysis instantly understandable

Why It Matters: Fundamental data tells you why prices should move, but not when the market will react. Technical Analysis bridges this gap by revealing when markets start believing the fundamental story. In volatile markets where timing can mean the difference between saving and losing on purchases in volatile markets. These indicators help procurement teams spot early trend changes, identify optimal entry points, and avoid buying at market extremes, without requiring trading expertise.

How to Use It:

  1. Add Technical Analysis to any dashboard by using the search function

  2. View the summary panel showing all three indicators at a glance

  3. Green arrows indicate upward pressure/momentum, red indicates downward

  4. Click the extended view for in depth analysis of the indicators

  5. Combine with Vesper's other forward-looking tools for complete forward looking intelligence

Related Features: Technical Analysis completes Vesper's forward-looking toolkit:

  • AI Forecasting predicts where prices are headed (the "how much")

  • Dashboard fundamentals explain market drivers (the "why")

  • Market reports provide expert context

  • Now Technical Analysis reveals entry point (the "when")

Did you like this update?

LikeNeutralDislike

Cost Models: Turn commodity benchmarks into product pricing

by Vesper Team
New
Food Manufacturing
Retail
Cost Models

Summary: Vesper has launched Cost Models, a powerful new feature that transforms individual commodity benchmarks into complete product cost insights. This capability allows food manufacturers to combine weighted commodity benchmarks with standardized non-ingredient costs to build accurate product pricing models, delivering unprecedented visibility into true product economics.

What's New:

  • Build complete product cost models by combining multiple commodity benchmarks with precise weightings

  • Access industry-standard non-ingredient costs (labor, manufacturing, overhead) specific to your region

  • Choose from our template library for common food products or create custom models

  • Track how each component contributes to your total product cost with automatic updates whenever source prices change

Why It Matters: With record-high volatility across food commodities, understanding how ingredient changes impact finished products is critical for maintaining margins. Cost Models provide complete cost structure visibility for your entire organization: procurement teams can verify supplier price increases, finance can track margin impacts across product portfolios, and sales teams can justify price adjustments to customers with independently verified data. Non-ingredient costs can represent up to 47% of total product costs—a critical component that's now visible alongside your commodity benchmarks.

How to Use It:

  1. Access Cost Models through the main dashboard menu

  2. Choose between starting with a template or building a model from scratch

  3. Select ingredients from your available commodities and assign precise weightings

  4. Add country-specific non-ingredient costs by selecting your industry and location

  5. Save your model to track cost evolution over time as prices update automatically

Related Features: Cost Models integrates seamlessly with Vesper's existing capabilities:

  • Individual commodity price benchmarks (VPI, Partner prices, and Public benchmarks found in prices widgets)

  • Incorporate into your own custom dashboards

  • Coming in Q3 2025: Forecasting capabilities for your cost models

Did you like this update?

LikeNeutralDislike

Fruits, Vegetables & Pulses News

by Vesper Team
New
Vegetables & Pulses
Fruit
News & Alerts

Summary: Vesper has expanded its news coverage with two dedicated categories: Vegetables & Pulses and Fruits. These new sections deliver focused, timely information on fresh produce markets, including harvest conditions, logistics updates, weather disruptions, pricing trends, and market developments.

What's New:

  • Dedicated news category for Vegetables & Pulses

  • Dedicated news category for Fruits

  • Comprehensive coverage of global fresh produce markets

  • Integration with existing news filtering and alert capabilities

Why It Matters: Fresh produce represents critical input markets for many of our core users. These new categories significantly deepen our current coverage, which has primarily focused on price benchmarks until now. By adding dedicated news streams, users gain deeper insights and earlier warning signals about market developments before they impact prices. This expanded coverage provides essential visibility into volatile produce markets, helping users anticipate supply disruptions, track pricing pressures, and identify emerging trends. This expansion responds directly to user feedback requesting more comprehensive coverage across the complete ingredient spectrum.


How to Use It:

  1. Find the new categories in the News section of the platform

  2. Set up custom alerts for specific commodities within these categories

  3. Filter news by these categories to focus on produce-specific updates

Related Features: These news categories complement Vesper's existing offerings:

  • Smart news filtering and aggregation

  • Custom news alerts

  • Fruits and Vegetables price benchmarks on the Dashboard

Read the latest news

Did you like this update?

LikeNeutralDislike

European Energy Futures

by Vesper Team
New
Energy & Transport
Data

Summary: Vesper has significantly expanded our European electricity futures coverage with the addition of comprehensive EEX data across 15 countries. This enhancement delivers detailed visibility into power markets throughout Europe, covering both base and peak load contracts across monthly, quarterly, and yearly timeframes.

What's New:

  • 86 new electricity futures contracts covering:

    • 15 European countries including Germany, France, UK, Italy, Spain, and more

    • Base and peak load power contracts

    • Monthly, quarterly, and yearly delivery periods

  • Available across multiple widgets including:

    • Futures widgets (Graph, Table, Historical Settle Graph)

    • Price & Price Comparison widget

Why It Matters: Energy costs represent a significant component of manufacturing expenses. With this expanded coverage, users can monitor electricity futures across their operational footprint, compare price trends between regions, and develop more effective energy procurement strategies based on forward market indicators.

How to Use It:

  1. Access these new products through any of the supported widgets

  2. Search by country name and contract type (e.g., "German Power Base")

  3. Compare electricity futures across different European markets

  4. Track forward curves to inform energy procurement decisions & Market outlook

Related Features: This expansion complements our existing energy market coverage:

  • Natural gas futures across major European hubs

Did you like this update?

LikeNeutralDislike

Extended Forecast Horizon - Dairy, Oils&Fats, Sugar

by Vesper Team
Dairy
Oils & Fats
Sugar & Sweeteners
Forecasting & Outlook

Whats New? Vesper is extending our AI-powered forecasting horizon from 6 to 12 months for select dairy, sugar, and oils commodities with established price histories (5+ years of data). This extended visibility enables procurement teams to move beyond tactical buying decisions to support annual budgeting and strategic planning.

Why it matters? Together with expert human analyst outlooks and comprehensive coverage of S&D/Fundamentals, the forecast powered by AI technology gives a comprehensive outlook on future market movements. The extended 12-month horizon allows users to incorporate forecasting into their decision making on more strategic timeframes.

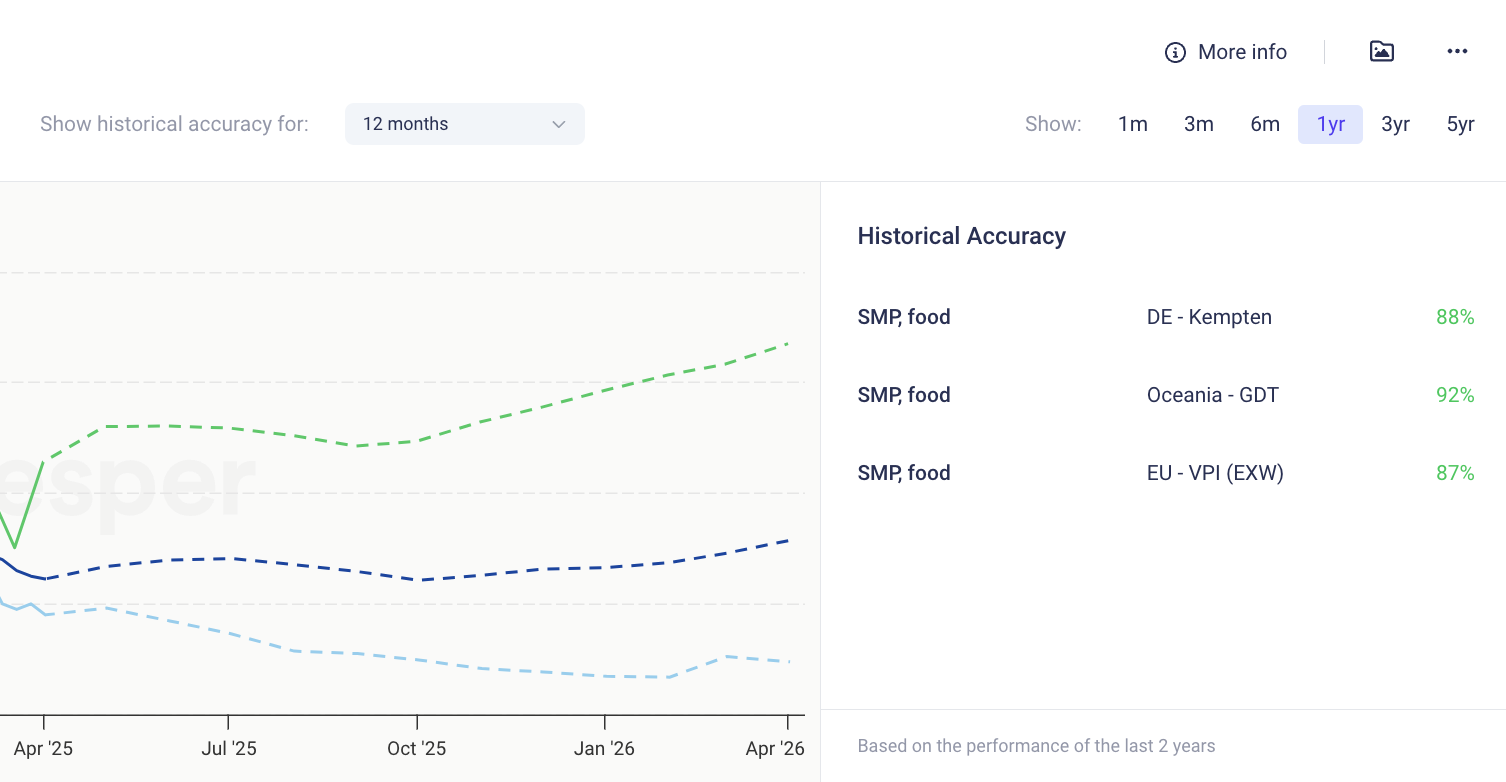
As always, forecasting accuracy is transparently available on the platform for each individual product, allowing users to assess performance and incorporate it into decision-making.

How to Use It:

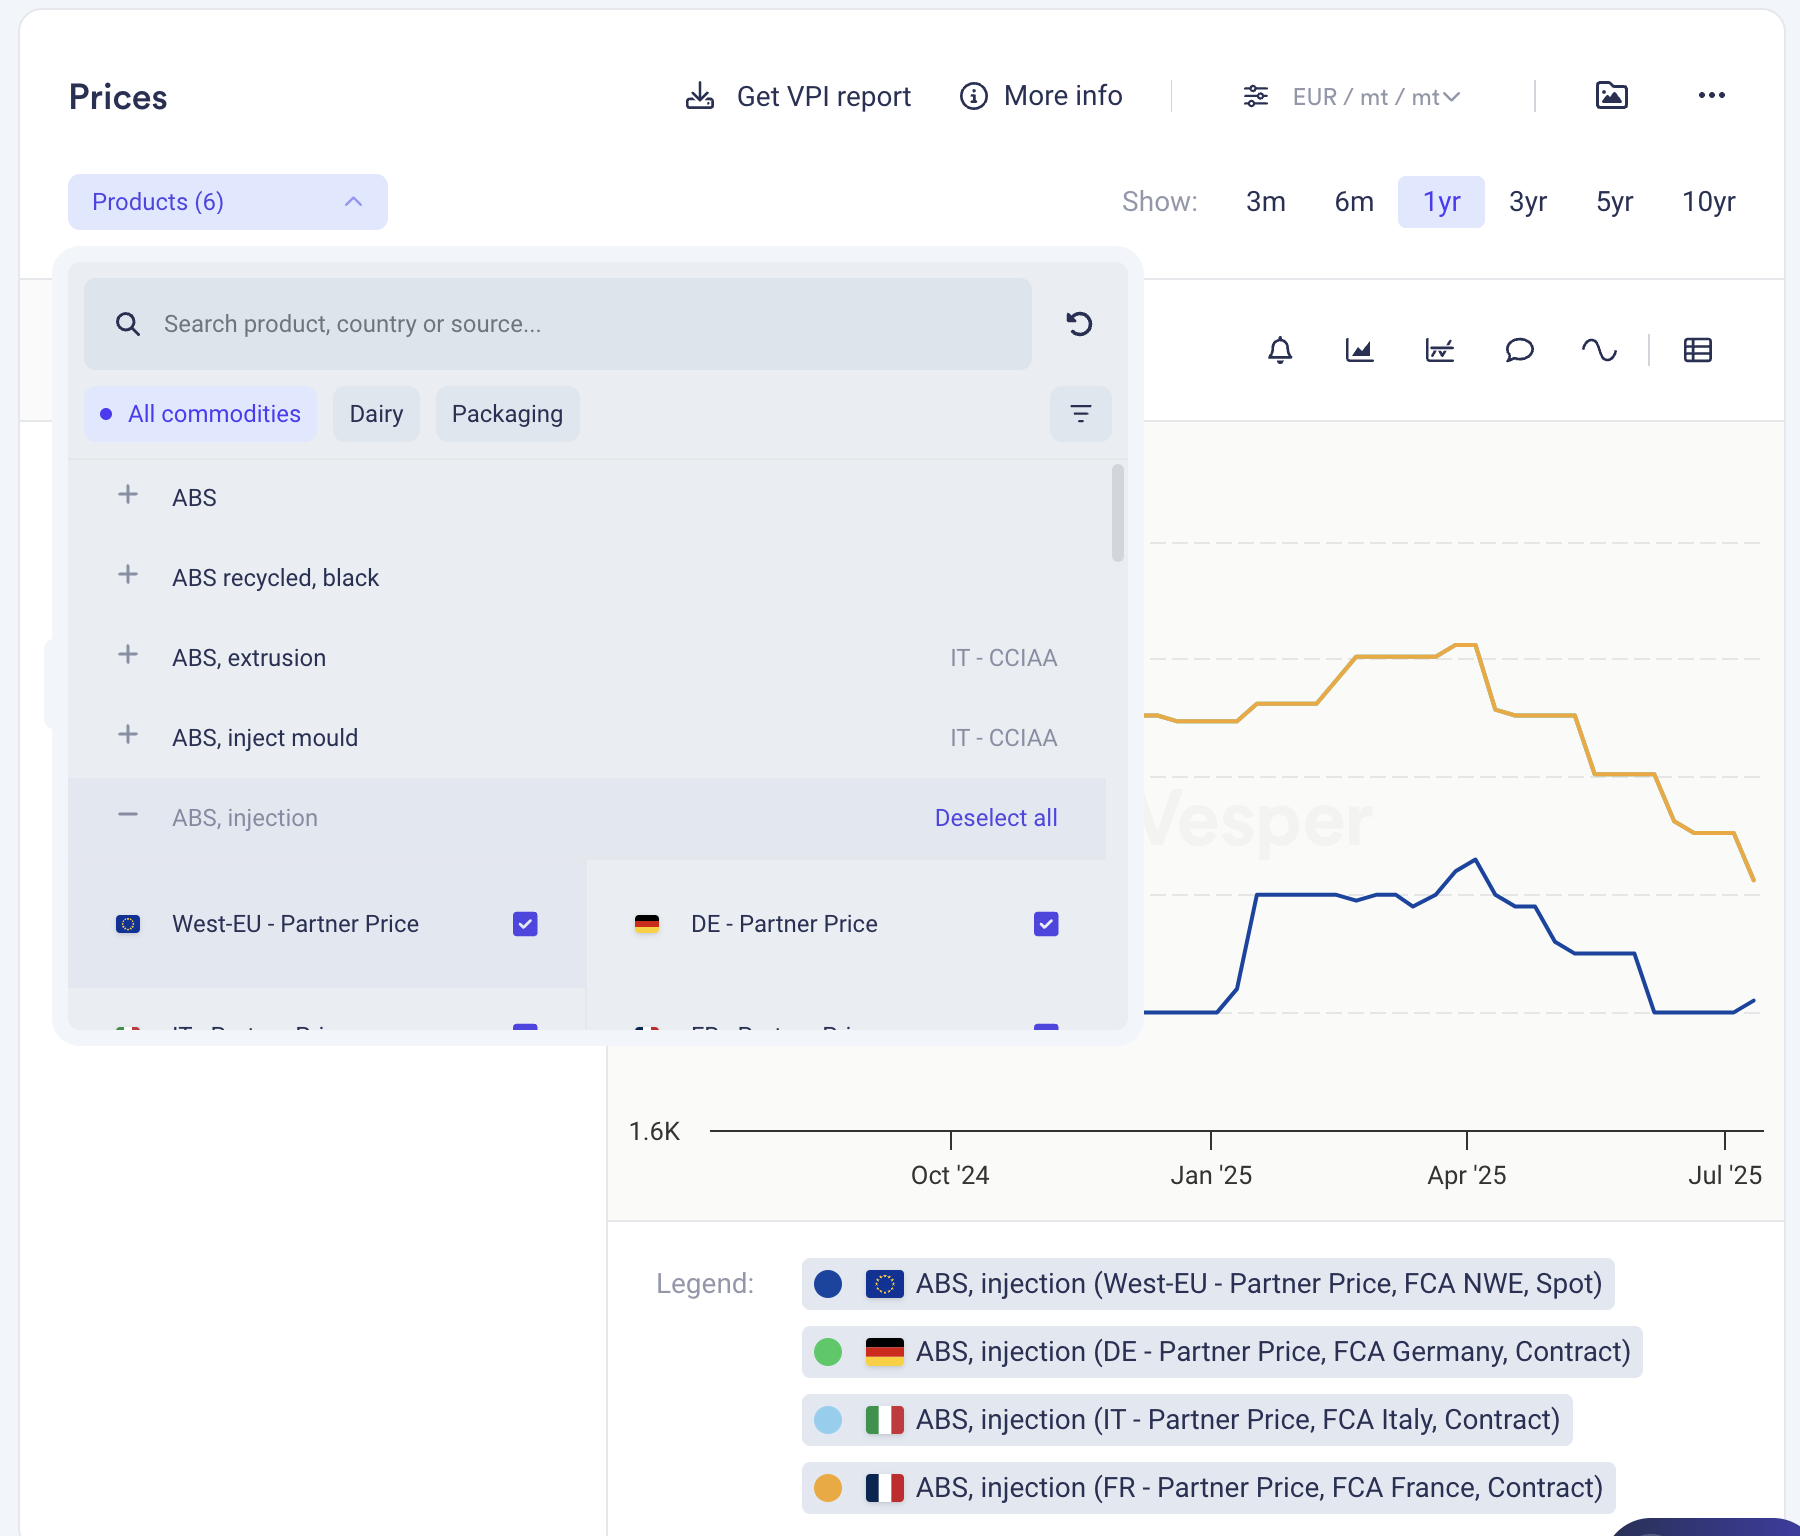
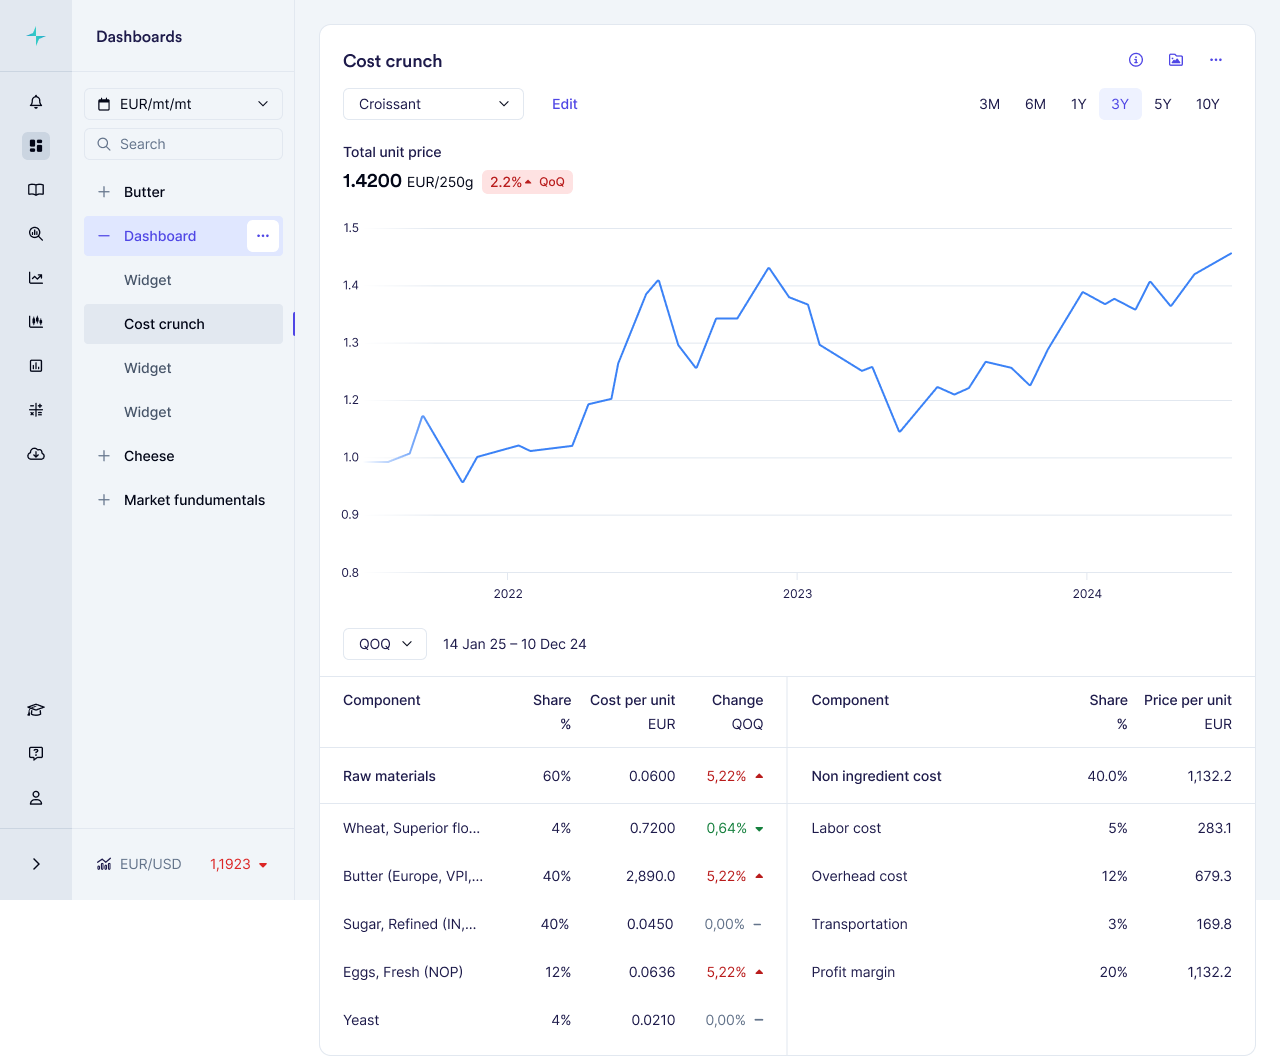
  1. Access the forecast widgets directly on your custom dashboards (add through the search tool if needed)

  2. If a product has a 12-Month forecast horizon, it will automatically be visible on your screen

  3. Check forecast performance by choosing the 12-Month option in the accuracy dropdown

More products will be added to the extended range in the course of Q2

Related Features: This extended forecasting complements our existing forward-looking toolkit:

  • Forward pricing up to 16 months ahead in the Forward Pricing widgets

  • Expert analyst outlooks for both short and long-term market perspectives

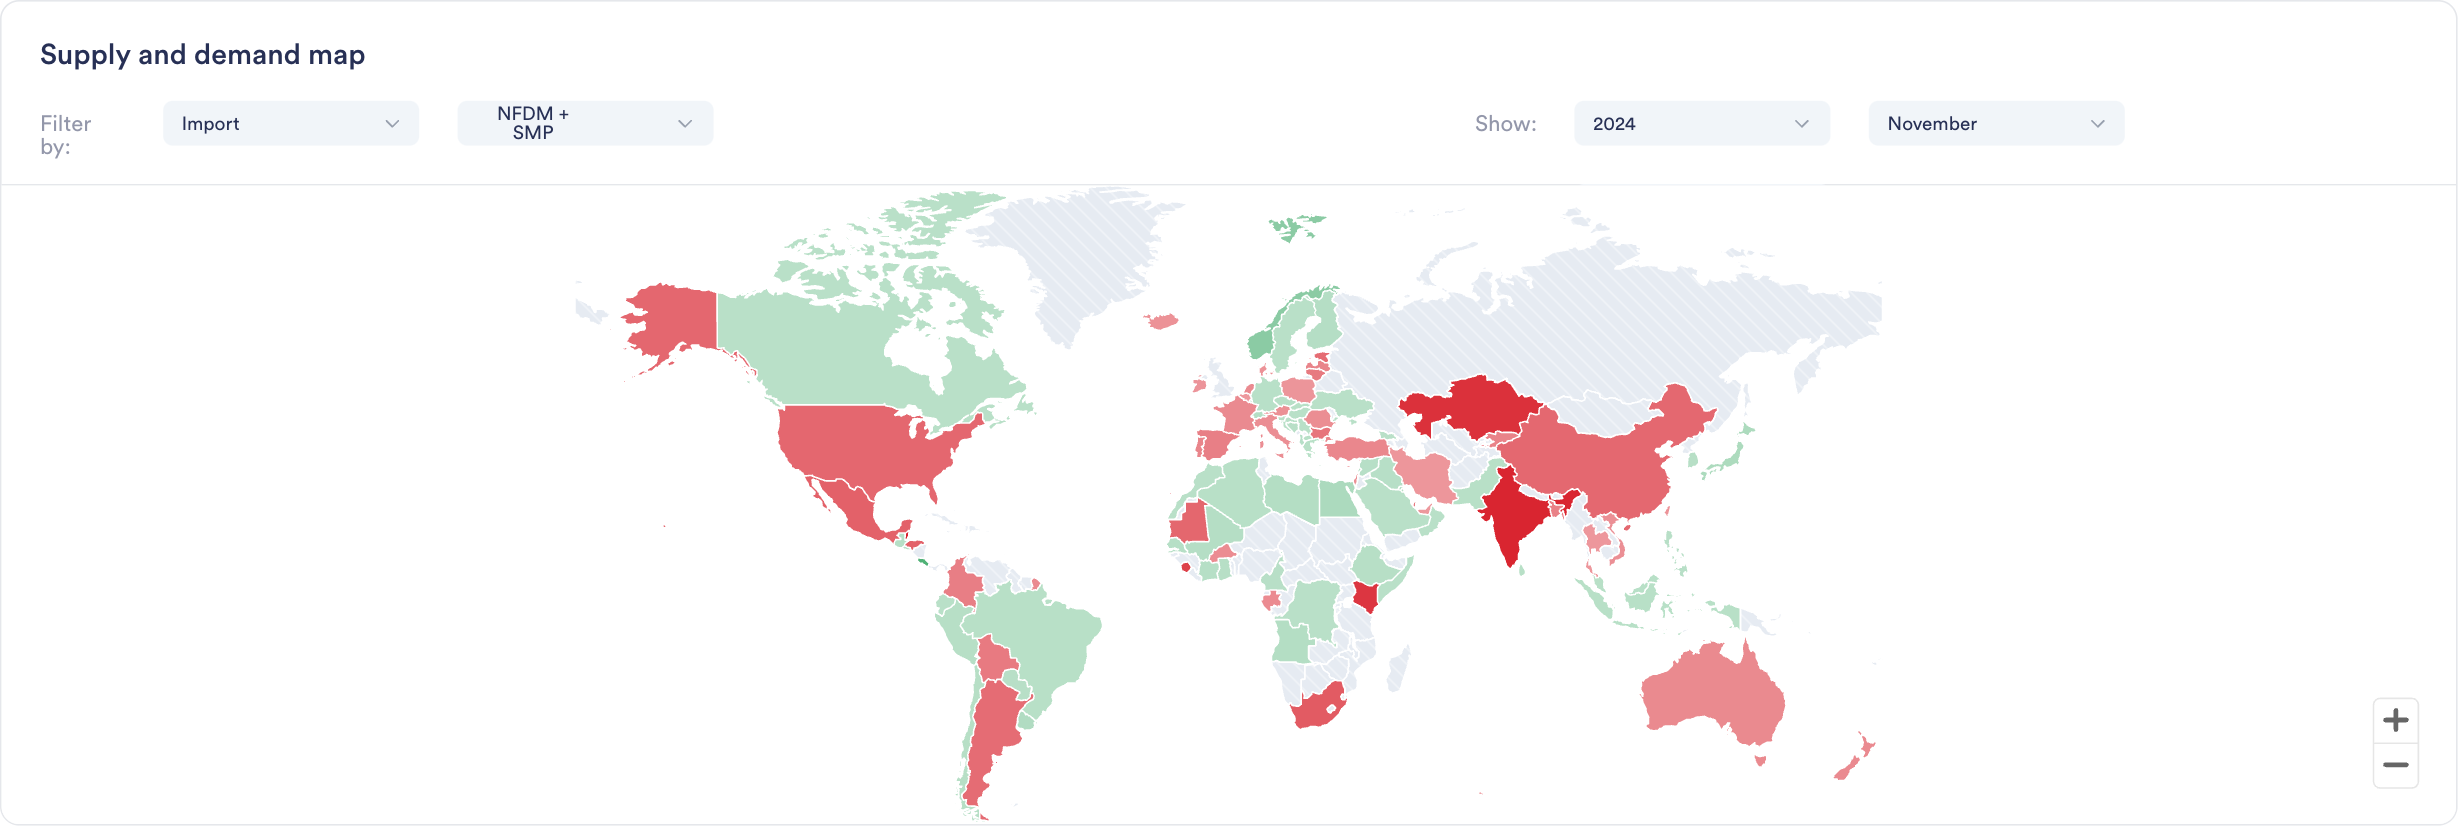
  • Fundamental market drivers dashboard for tracking supply and demand trends

These combined tools give procurement teams unprecedented visibility into future market movements for more confident strategic planning.

Did you like this update?

LikeNeutralDislike

Meat & Poultry News

by Vesper Team
New
Meat & Poultry
News & Alerts

Launched comprehensive news coverage for meat and poultry markets, powered by custom machine learning models that filter and analyze global news sources to deliver relevant, real-time market intelligence.

Why it Matters: Staying ahead in volatile meat and poultry markets requires more than price data. Our data science team has developed specialized models that scan thousands of global news sources, filtering out noise to deliver only relevant market intelligence—giving you the full context needed.

What's New:

  • Live news feed powered by custom ML models that:

    • Track thousands of global news sources

    • Filter for market-moving events

    • Identify relevant industry trends

    • Deliver real-time updates

  • Coverage across all major meat and poultry categories

How to Use It:

  1. Access the Meat & Poultry tab in your news section

  2. Set up notifications for news keywords to keep updated on relevant headlines

Head to news section

Did you like this update?

LikeNeutralDislike

Introducting Brazilian Instituto de Economia Agrícola (IEA) Source

by Vesper Team
New
Data
Nuts, Seeds & Dried Fruits
Meat & Poultry
Vegetables & Pulses

Added daily Brazilian public prices from Instituto de Economia Agrícola (IEA), Brazil's leading agricultural economics institute, expanding our coverage of key food commodities with local market data.

Why it Matters: Brazil is a major global producer and price setter for multiple food commodities. Direct access to daily IEA data provides unprecedented visibility into local market dynamics, helping procurement teams better understand price movements at origin and optimize sourcing strategies.

What's New:

  • Daily price updates across multiple categories:

    • Meat & Poultry: Chicken cuts (breast fillet, thigh, leg quarters), Pork cuts (loin, steak), Beef cuts (ribeye, round eye, brisket)

    • Nuts & Seeds: Peanuts in shell

    • Vegetables: Garlic (violet, violet size 0.7)

  • Key features:

    • Daily frequency updates

    • 4 years of historical data

    • Local market prices from São Paulo state

    • Original source data direct from IEA

How to Use It:

  1. Access Brazilian benchmarks in the Prices widgets by searching for the product name or filtering by BR-IEA source

Did you like this update?

LikeNeutralDislike

Supply and Demand Map Improvements

by Vesper Team
Improvement
Data

Enhanced S&D Map visualization now provides Year-to-Date (YTD) comparisons across regions, enabling instant visual insights into global production, import/export, and stock trends and regional shifts.

Why it Matters:"If I were interested to see where growth in EU milk production is happening, this would really quickly show me that it is not happening in Ireland, Netherlands or France. It's great for presentations, as not having to click through all countries at the same time makes it ideal for regions or groups of countries."

Jasper Endlich, Dairy Market Analyst

How to Use It:

  1. Find the World Map Widget in the S&D category

  2. Select your metric and timeframe of interest

  3. Compare countries and spot regional trends through color coding

  4. Export directly into presentations or add to your custom dashboards

Did you like this update?

LikeNeutralDislike