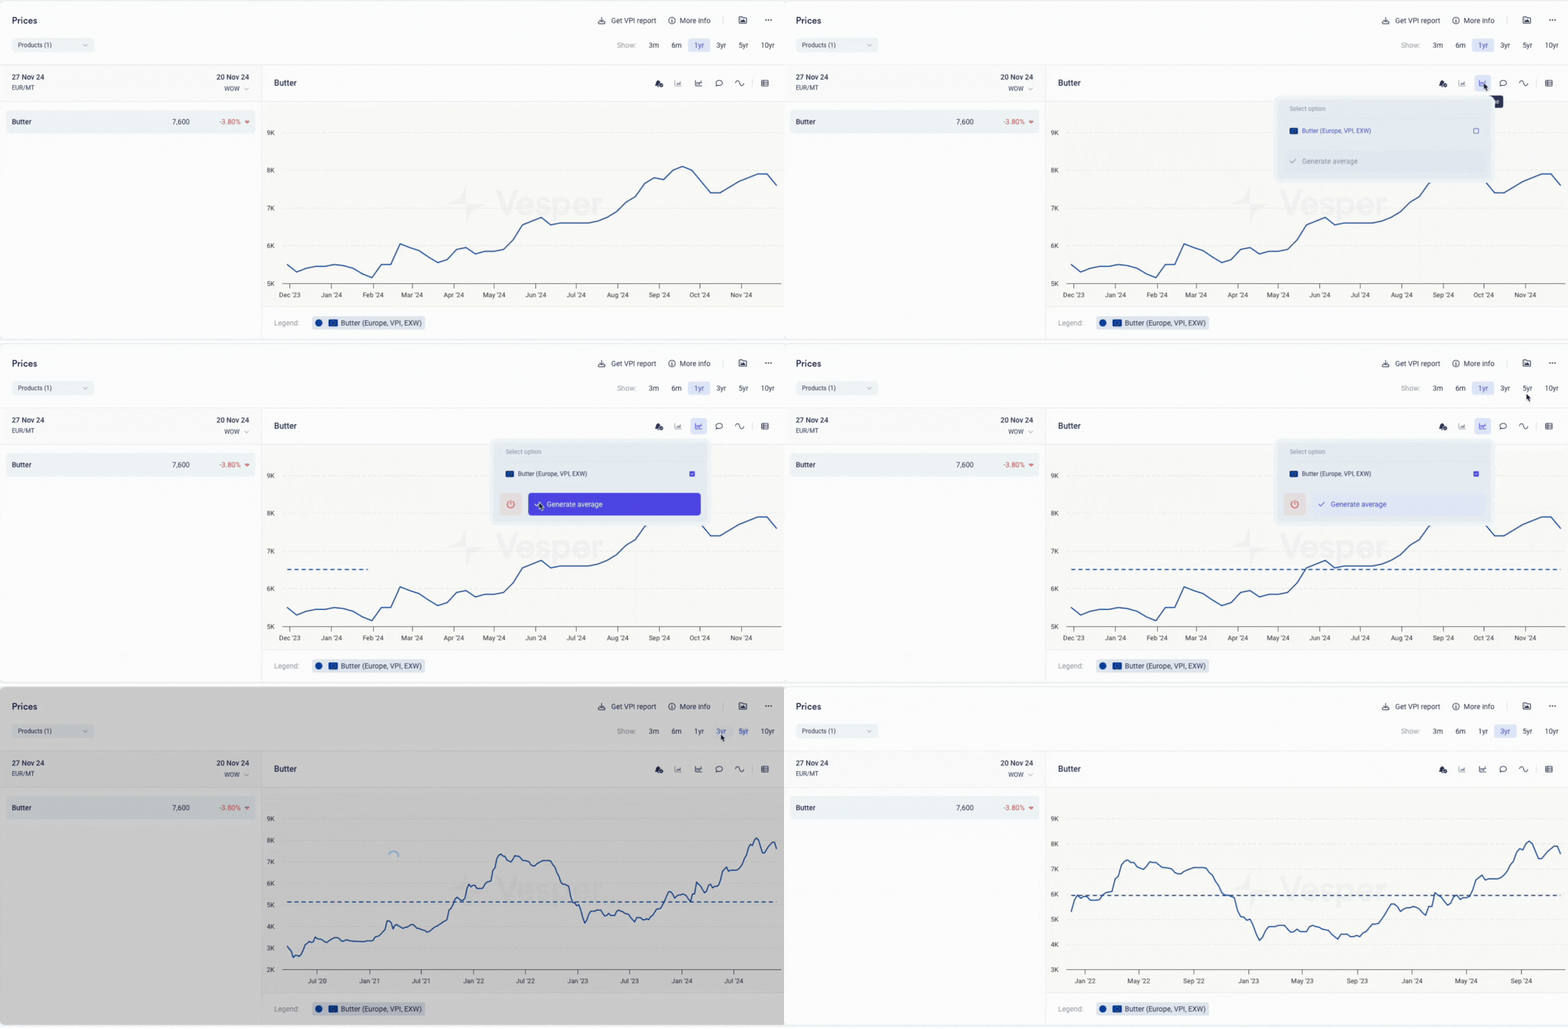
Add Average Line to Price Charts with One Click
1727719200000
New
Improvement
Vesper Toolbox

Summary: Added one-click average line functionality to price widgets, automatically adjusting to your selected time frame.
What's New:
Average line button in price widgets
Automatic calculation based on selected timeframe
Updates when time frame changes
Why It Matters: Quickly visualize price trends against historical averages to better understand market movements and support your decisions.
How to Use It:
Open any price widget
Click the Average line button at the top
Adjust time frame as needed in top right
Did you like this update?
![]()
![]()
![]()
