Commodity Copilot is now accessible from any dashboard through a side panel. Ask questions as you work with your data.
What's new:
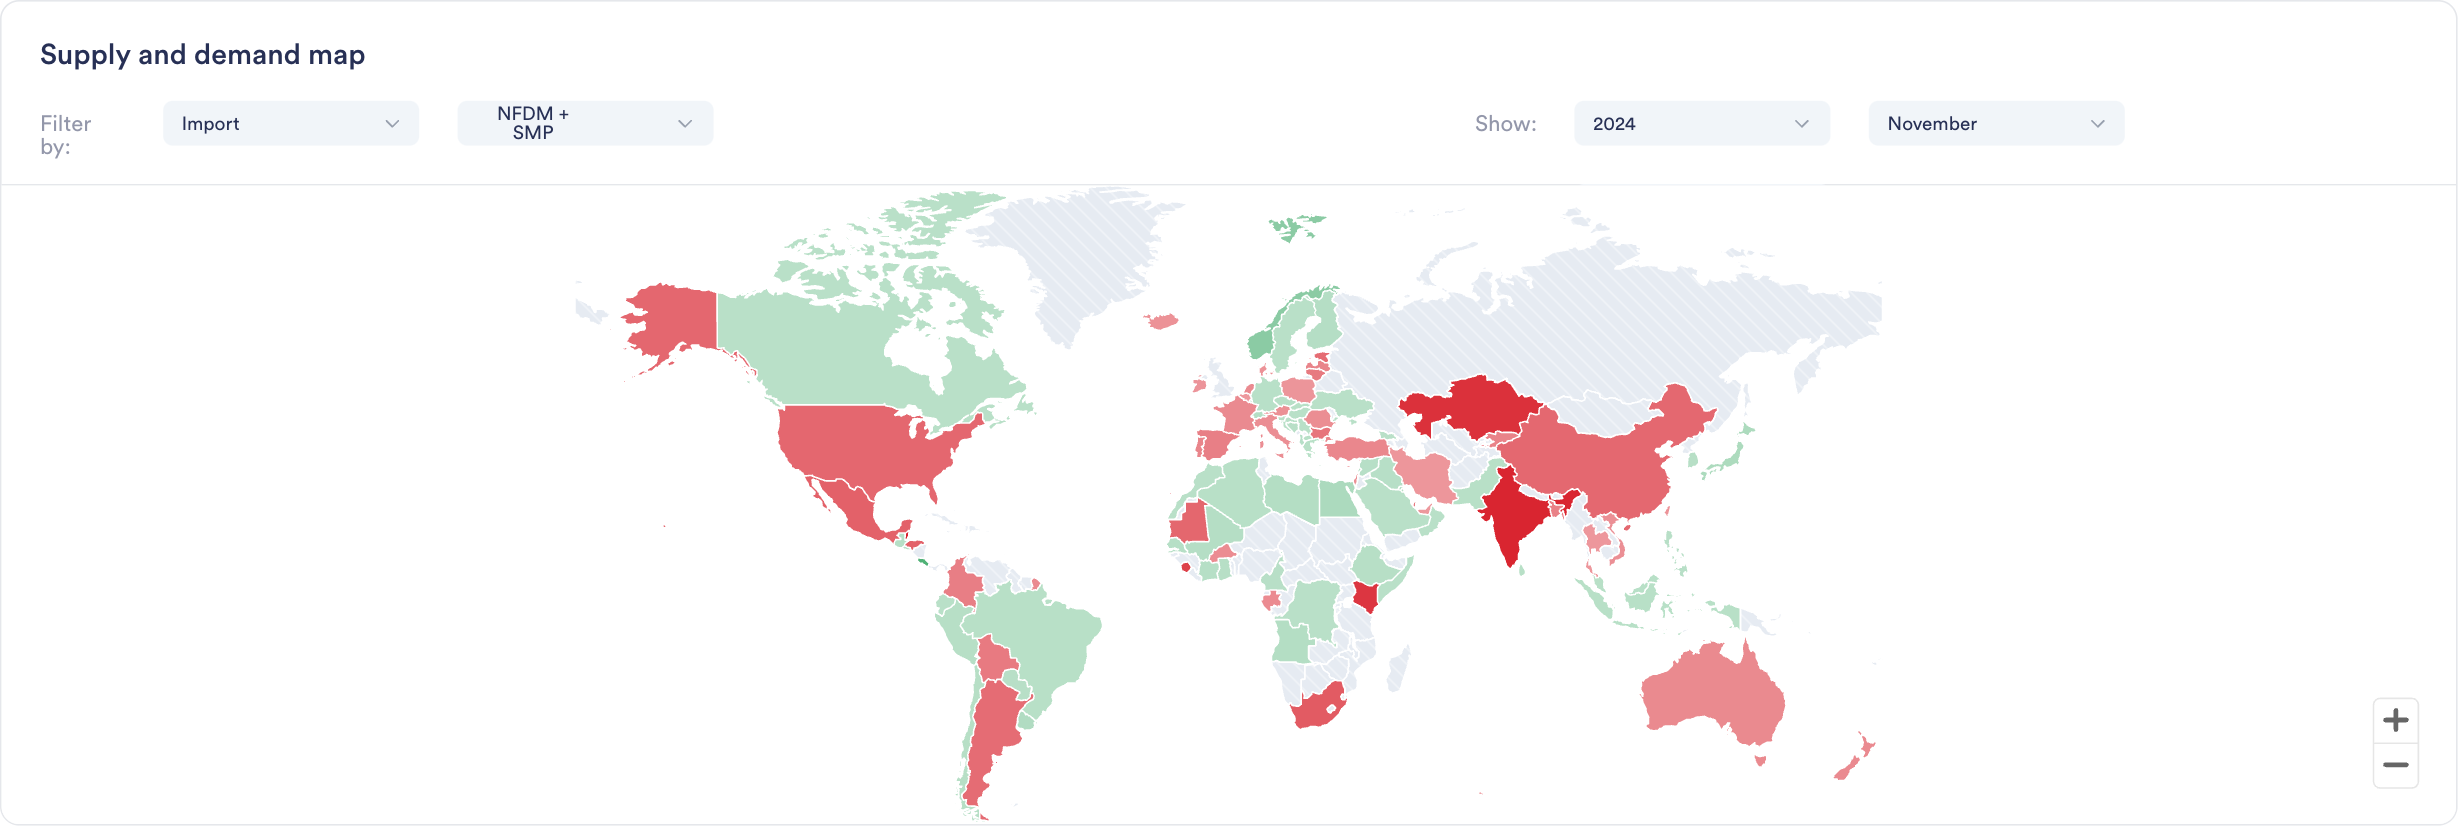
Copilot side panel is available on every dashboard. Open it without leaving your current view.
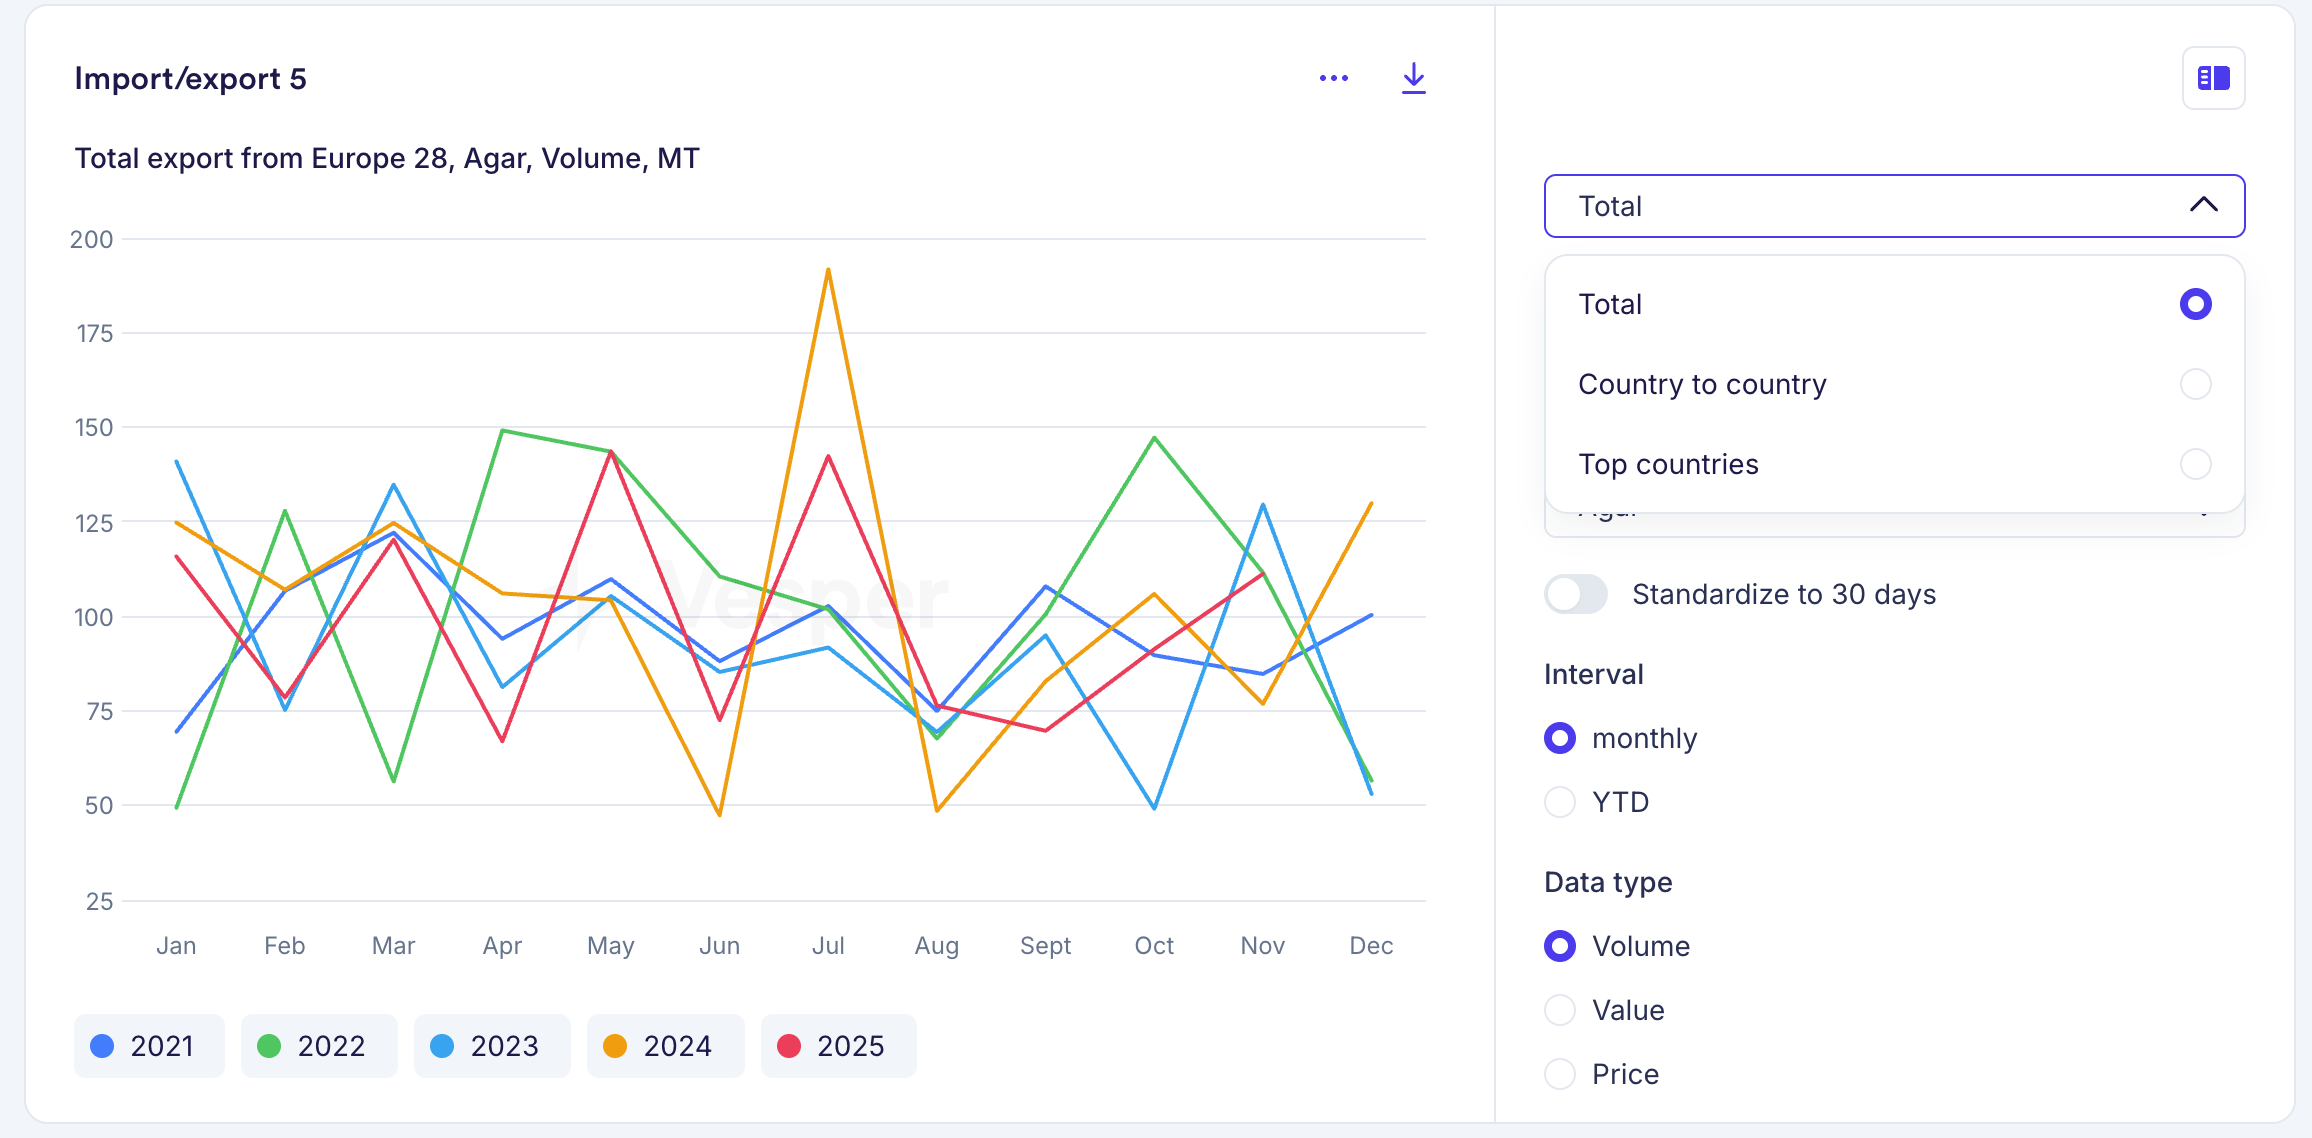
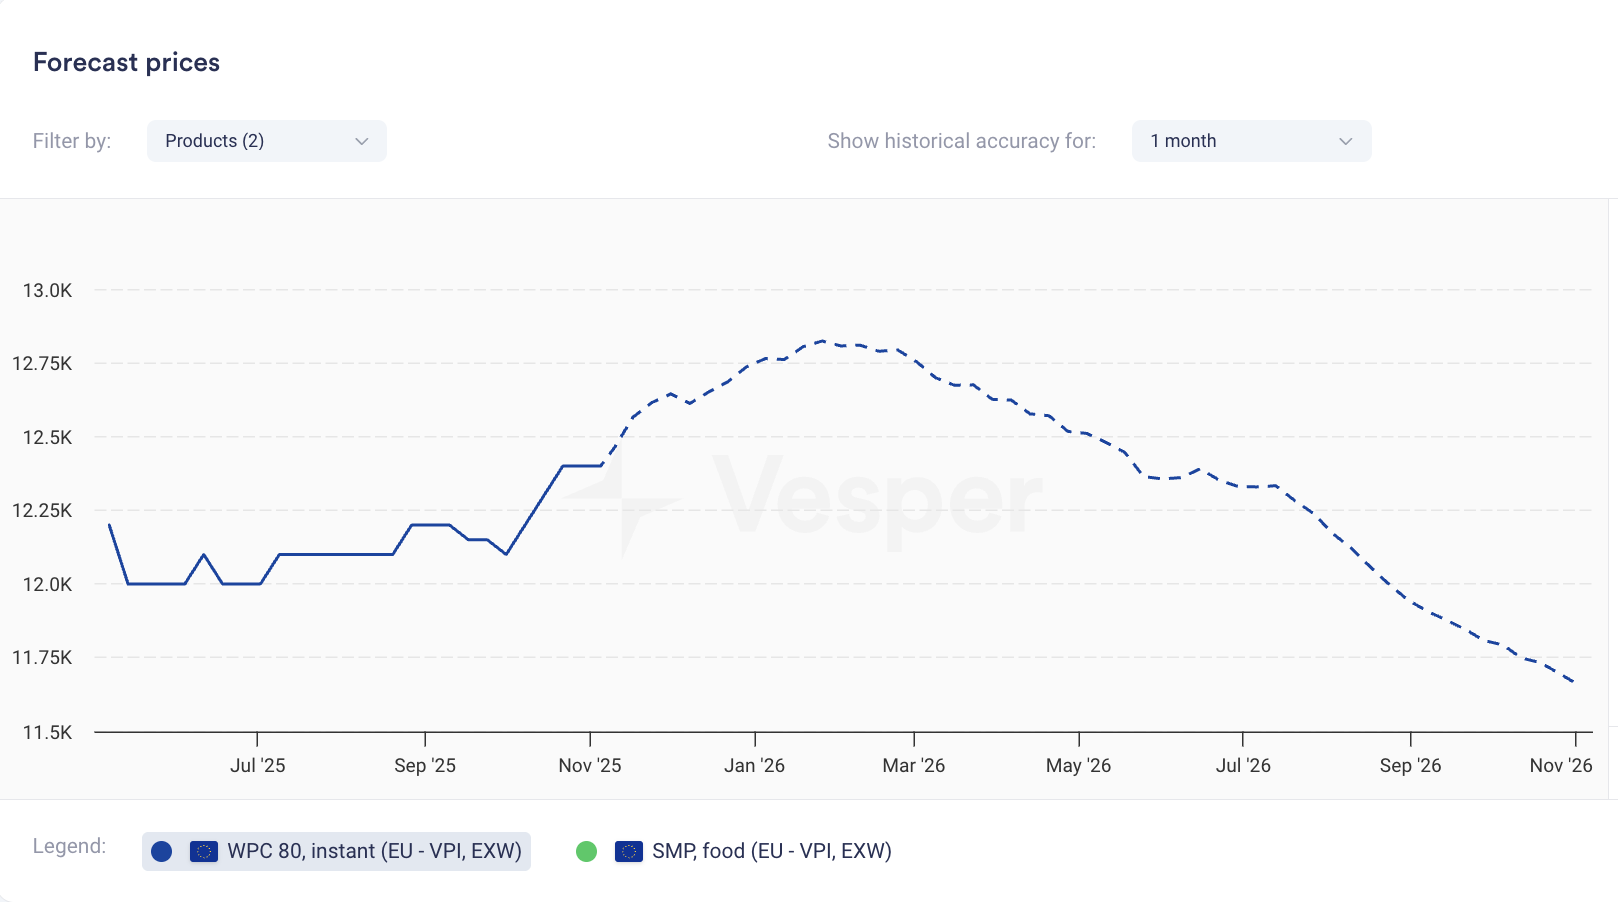
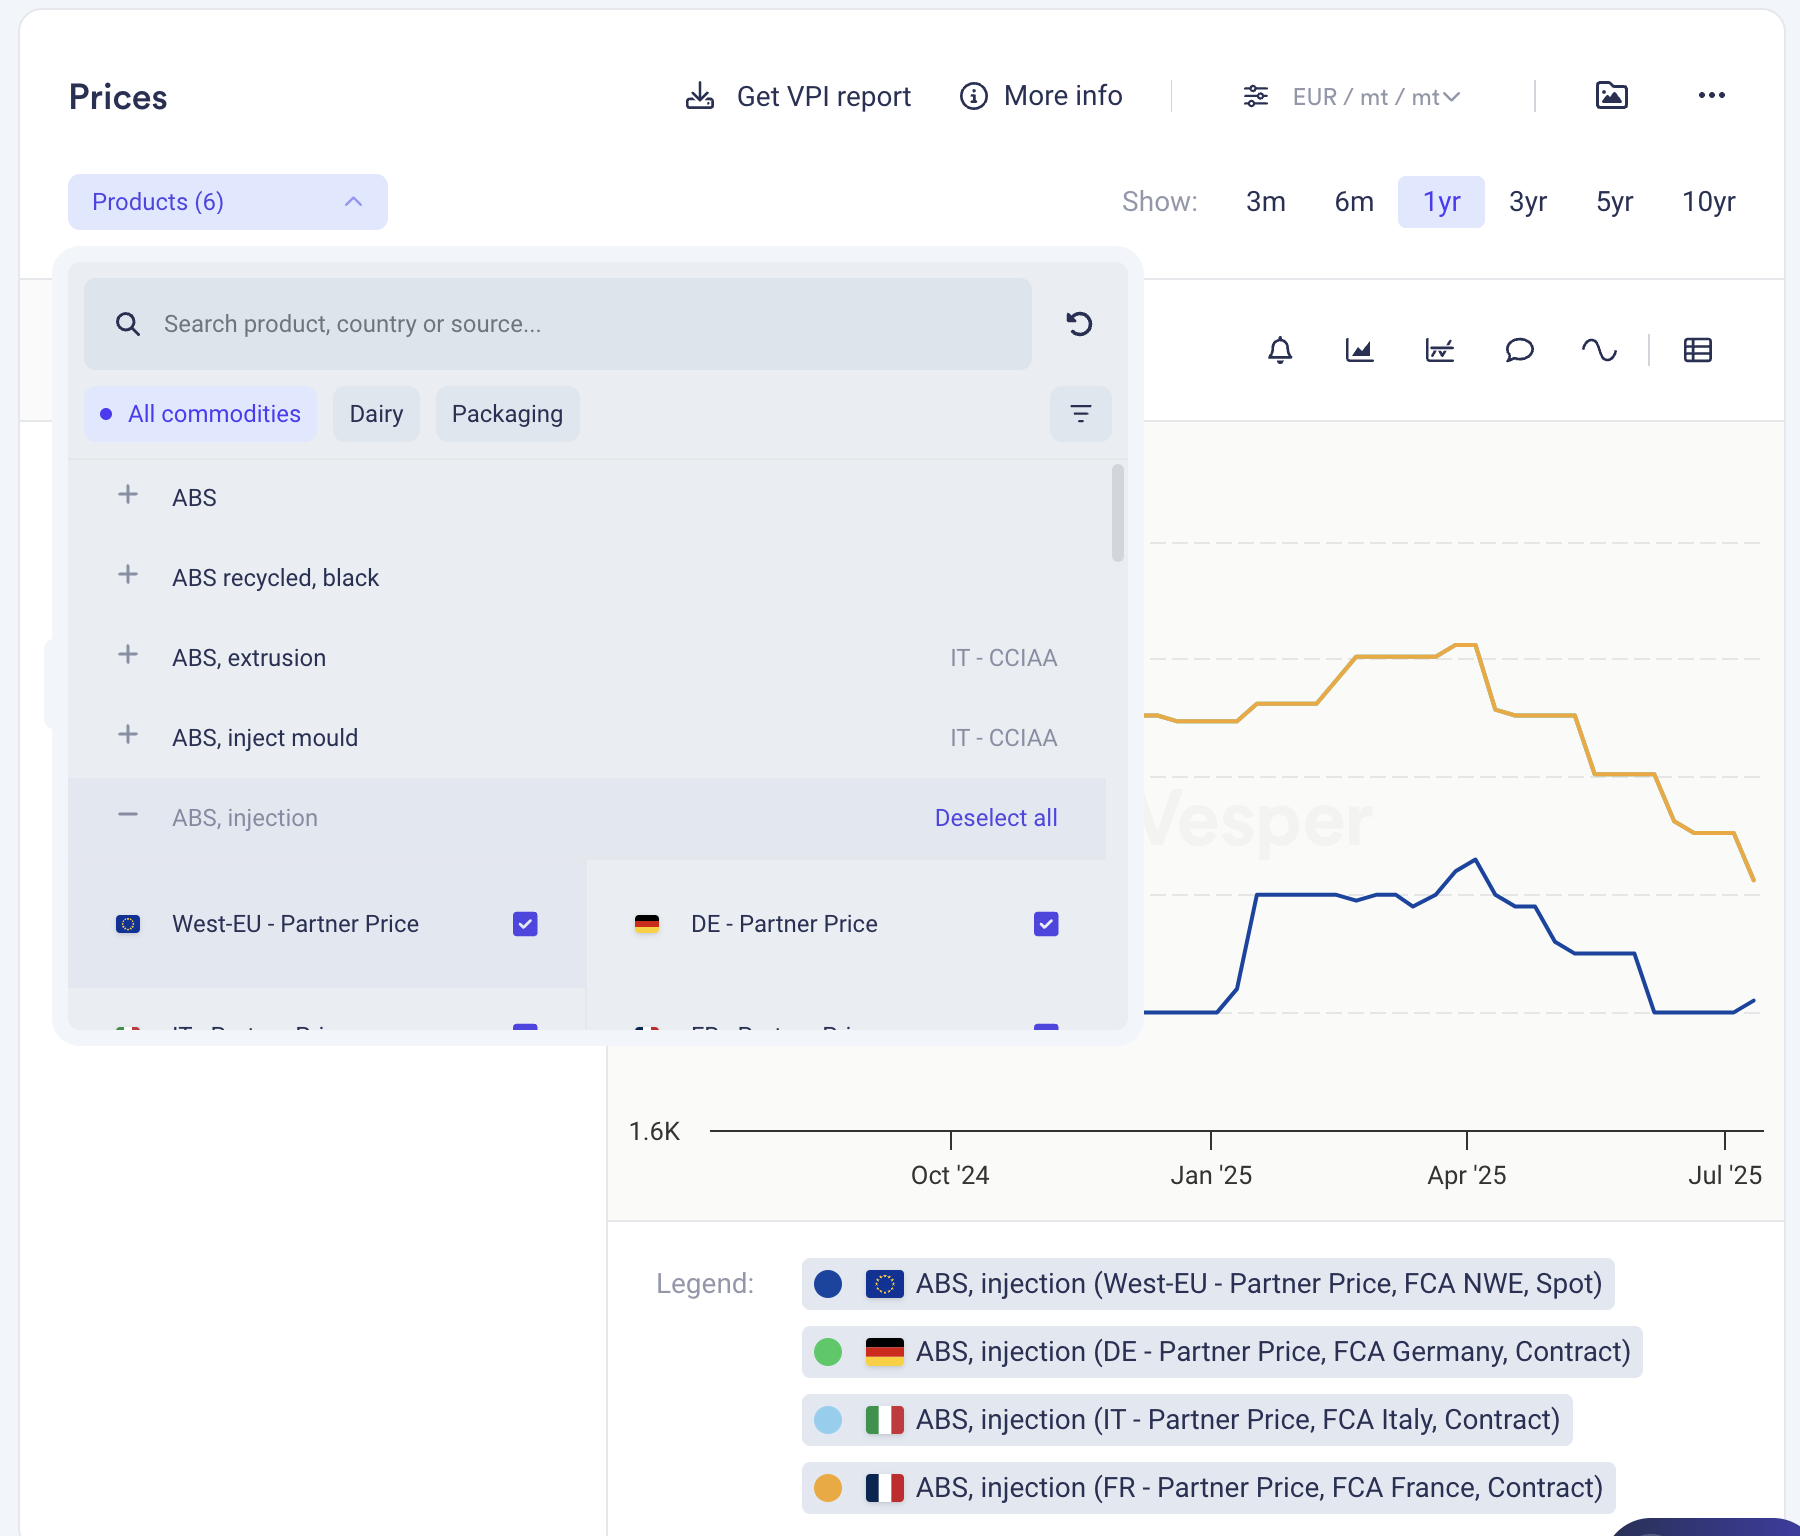
See your prices, charts, and reports on the left. Ask Copilot about them on the right.
Spot something in the data you want to understand? Just ask.
Why this matters:
Before this update, using Copilot meant navigating to a separate page. Now you can look at a price move in your chart and ask what's driving it without losing your place. Data and interpretation, side by side.
How to access?
Open the Copilot side panel using the icon in the top-right of any dashboard, or contact your Customer Success Manager at [email protected].