Vesper  Updates

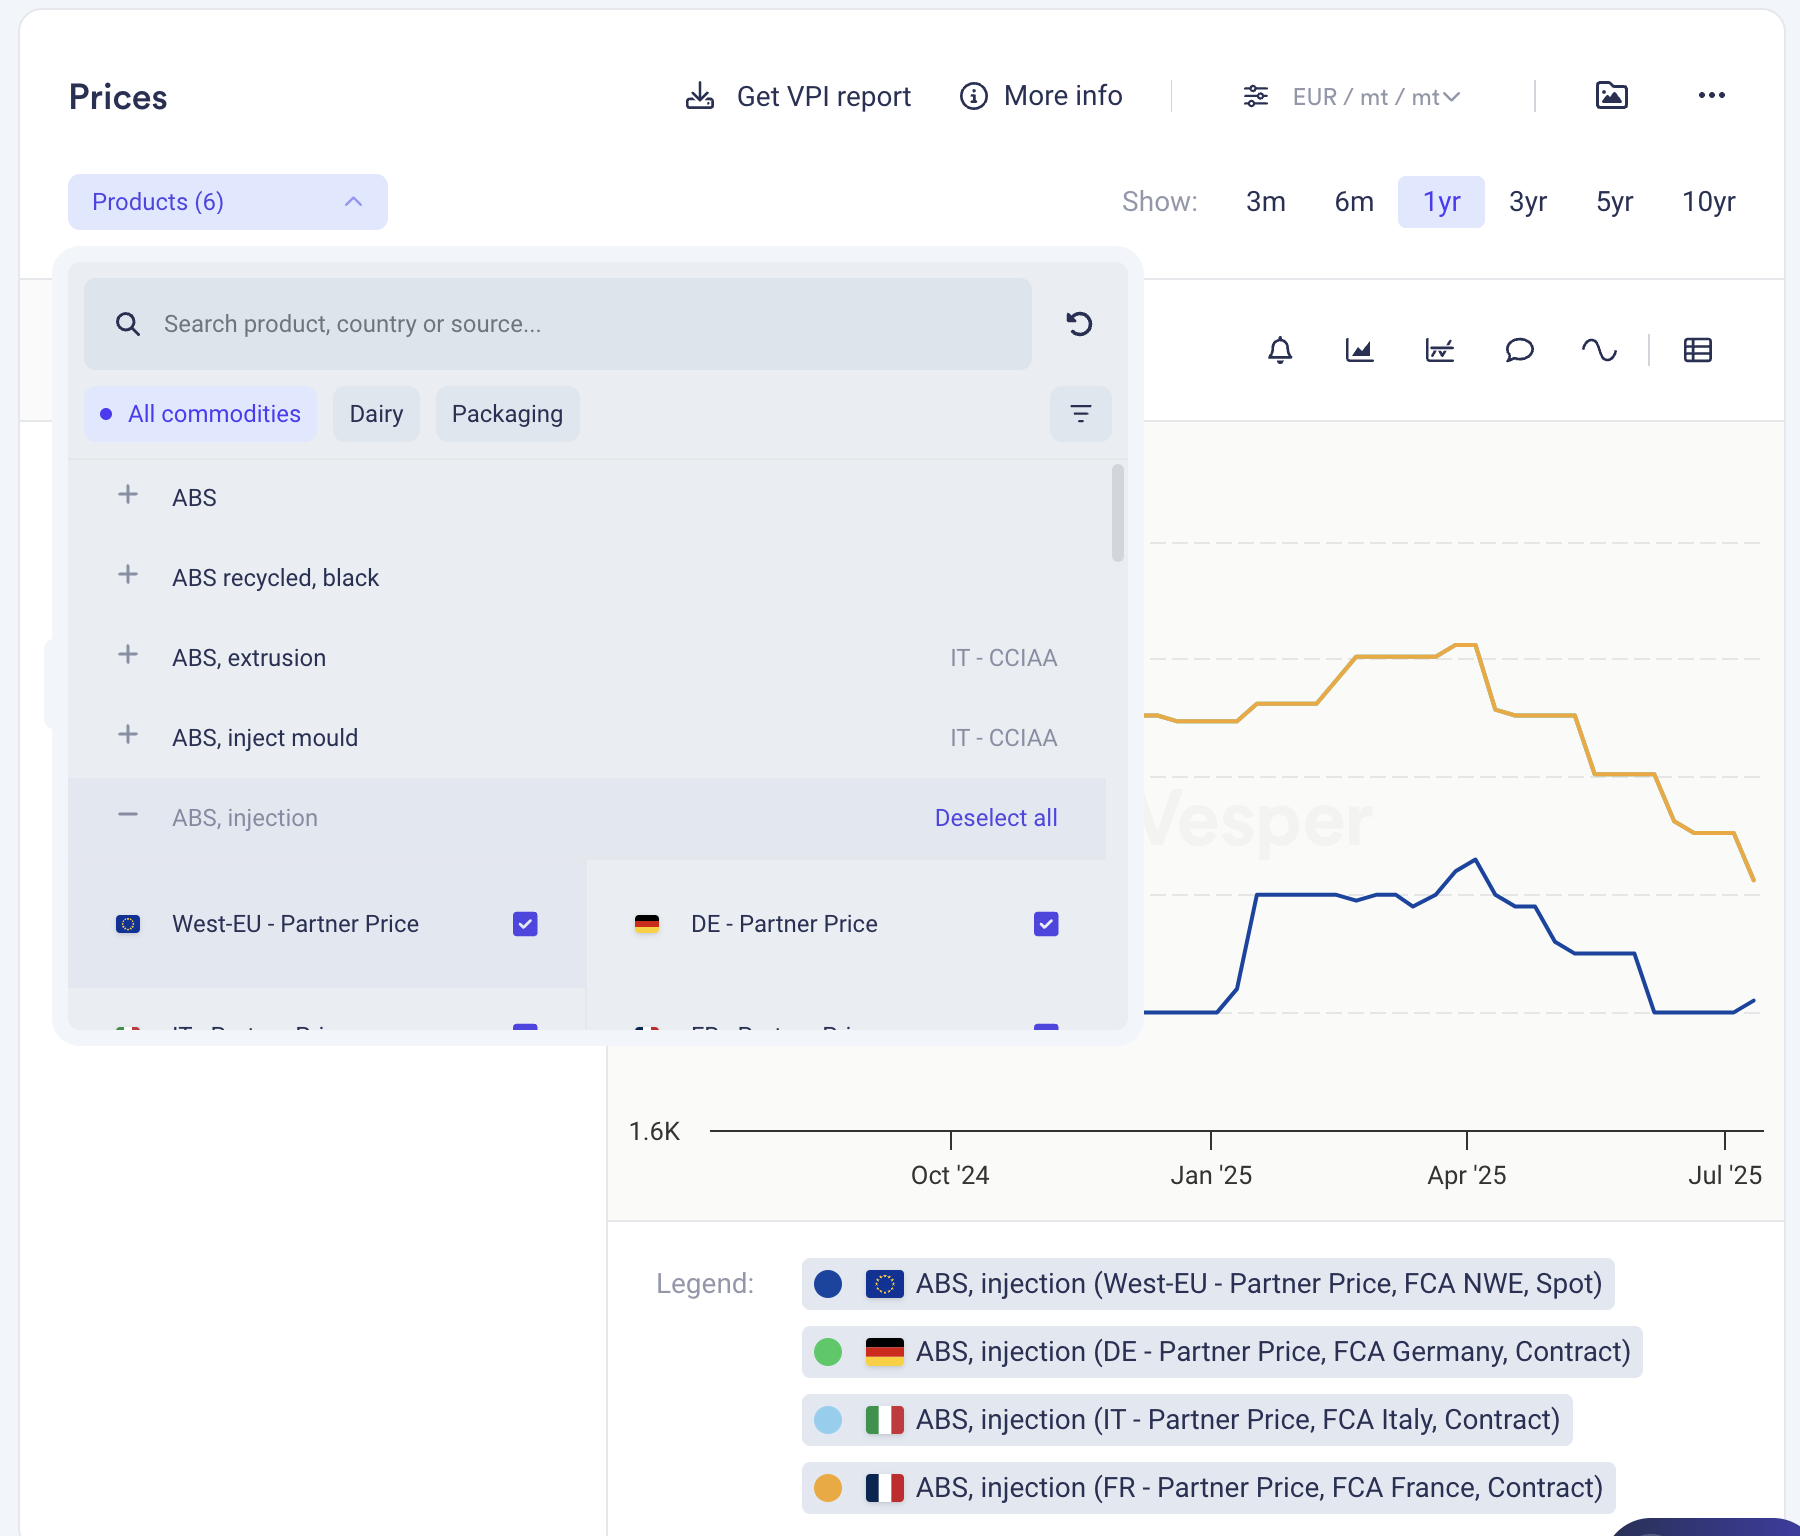
New: Deselect All Button

by Vesper Team, Product Marketing
Improvement
New
Vesper Toolbox

Clear your widget selections instantly with the new "Deselect all" button in dropdown menus. Start fresh analysis without manually removing each selection or dealing with cluttered views.

What it does: One click clears all active selections in a widget What you can do: Reset widgets to empty state for clean analysis Why it matters: Faster workflow, cleaner screens, less clicking

Find it in the dropdown menus across most widgets.

Did you like this update?

LikeNeutralDislike

Fruits, Vegetables & Pulses News

by Vesper Team
New
Vegetables & Pulses
Fruit
News & Alerts

Summary: Vesper has expanded its news coverage with two dedicated categories: Vegetables & Pulses and Fruits. These new sections deliver focused, timely information on fresh produce markets, including harvest conditions, logistics updates, weather disruptions, pricing trends, and market developments.

What's New:

  • Dedicated news category for Vegetables & Pulses

  • Dedicated news category for Fruits

  • Comprehensive coverage of global fresh produce markets

  • Integration with existing news filtering and alert capabilities

Why It Matters: Fresh produce represents critical input markets for many of our core users. These new categories significantly deepen our current coverage, which has primarily focused on price benchmarks until now. By adding dedicated news streams, users gain deeper insights and earlier warning signals about market developments before they impact prices. This expanded coverage provides essential visibility into volatile produce markets, helping users anticipate supply disruptions, track pricing pressures, and identify emerging trends. This expansion responds directly to user feedback requesting more comprehensive coverage across the complete ingredient spectrum.


How to Use It:

  1. Find the new categories in the News section of the platform

  2. Set up custom alerts for specific commodities within these categories

  3. Filter news by these categories to focus on produce-specific updates

Related Features: These news categories complement Vesper's existing offerings:

  • Smart news filtering and aggregation

  • Custom news alerts

  • Fruits and Vegetables price benchmarks on the Dashboard

Read the latest news

Did you like this update?

LikeNeutralDislike

Supply and Demand Map Improvements

by Vesper Team
Improvement
Data

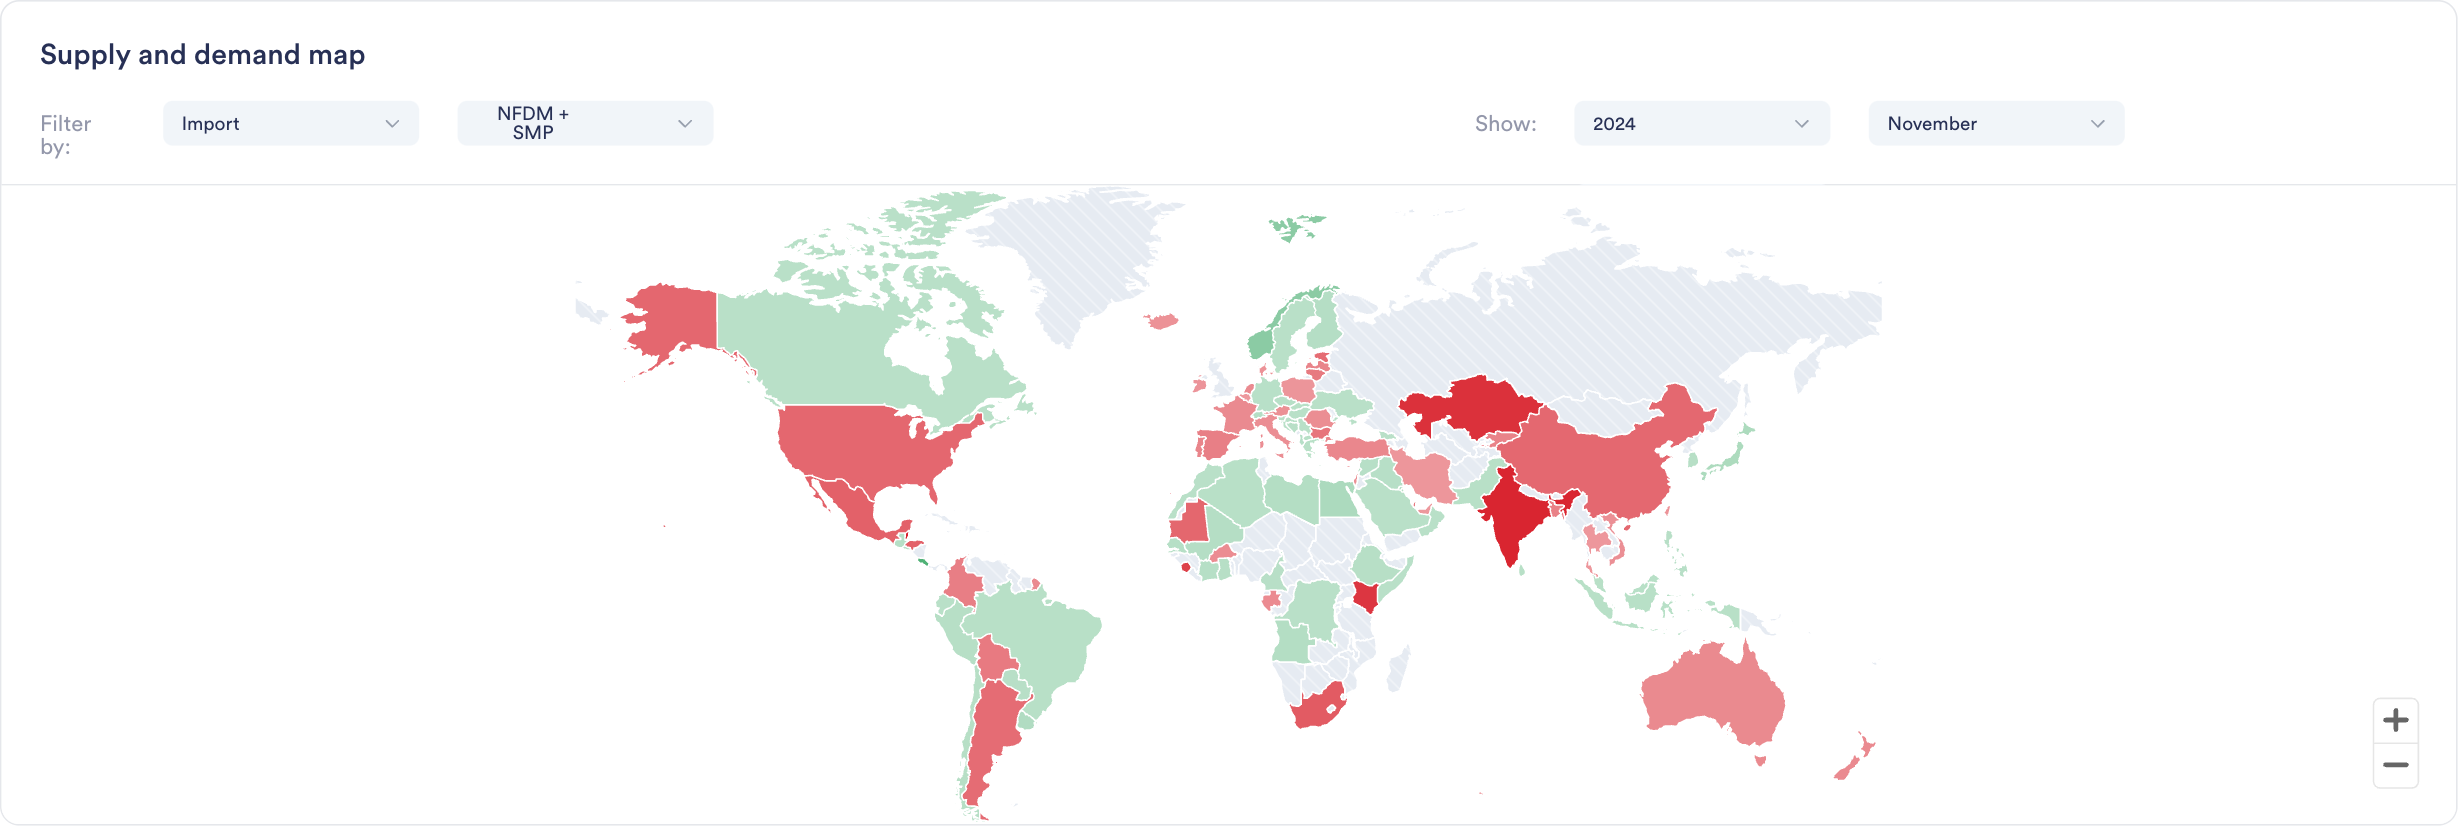
Enhanced S&D Map visualization now provides Year-to-Date (YTD) comparisons across regions, enabling instant visual insights into global production, import/export, and stock trends and regional shifts.

Why it Matters:"If I were interested to see where growth in EU milk production is happening, this would really quickly show me that it is not happening in Ireland, Netherlands or France. It's great for presentations, as not having to click through all countries at the same time makes it ideal for regions or groups of countries."

Jasper Endlich, Dairy Market Analyst

How to Use It:

  1. Find the World Map Widget in the S&D category

  2. Select your metric and timeframe of interest

  3. Compare countries and spot regional trends through color coding

  4. Export directly into presentations or add to your custom dashboards

Did you like this update?

LikeNeutralDislike

Introducing Two New Ways to Find What You Need

by Vesper Team
New
Improvement


We've launched two powerful features to help you navigate the platform more efficiently: Dashboard Search and Vesbot. Each serves a distinct purpose to help you find exactly what you need, when you need it.

What's New

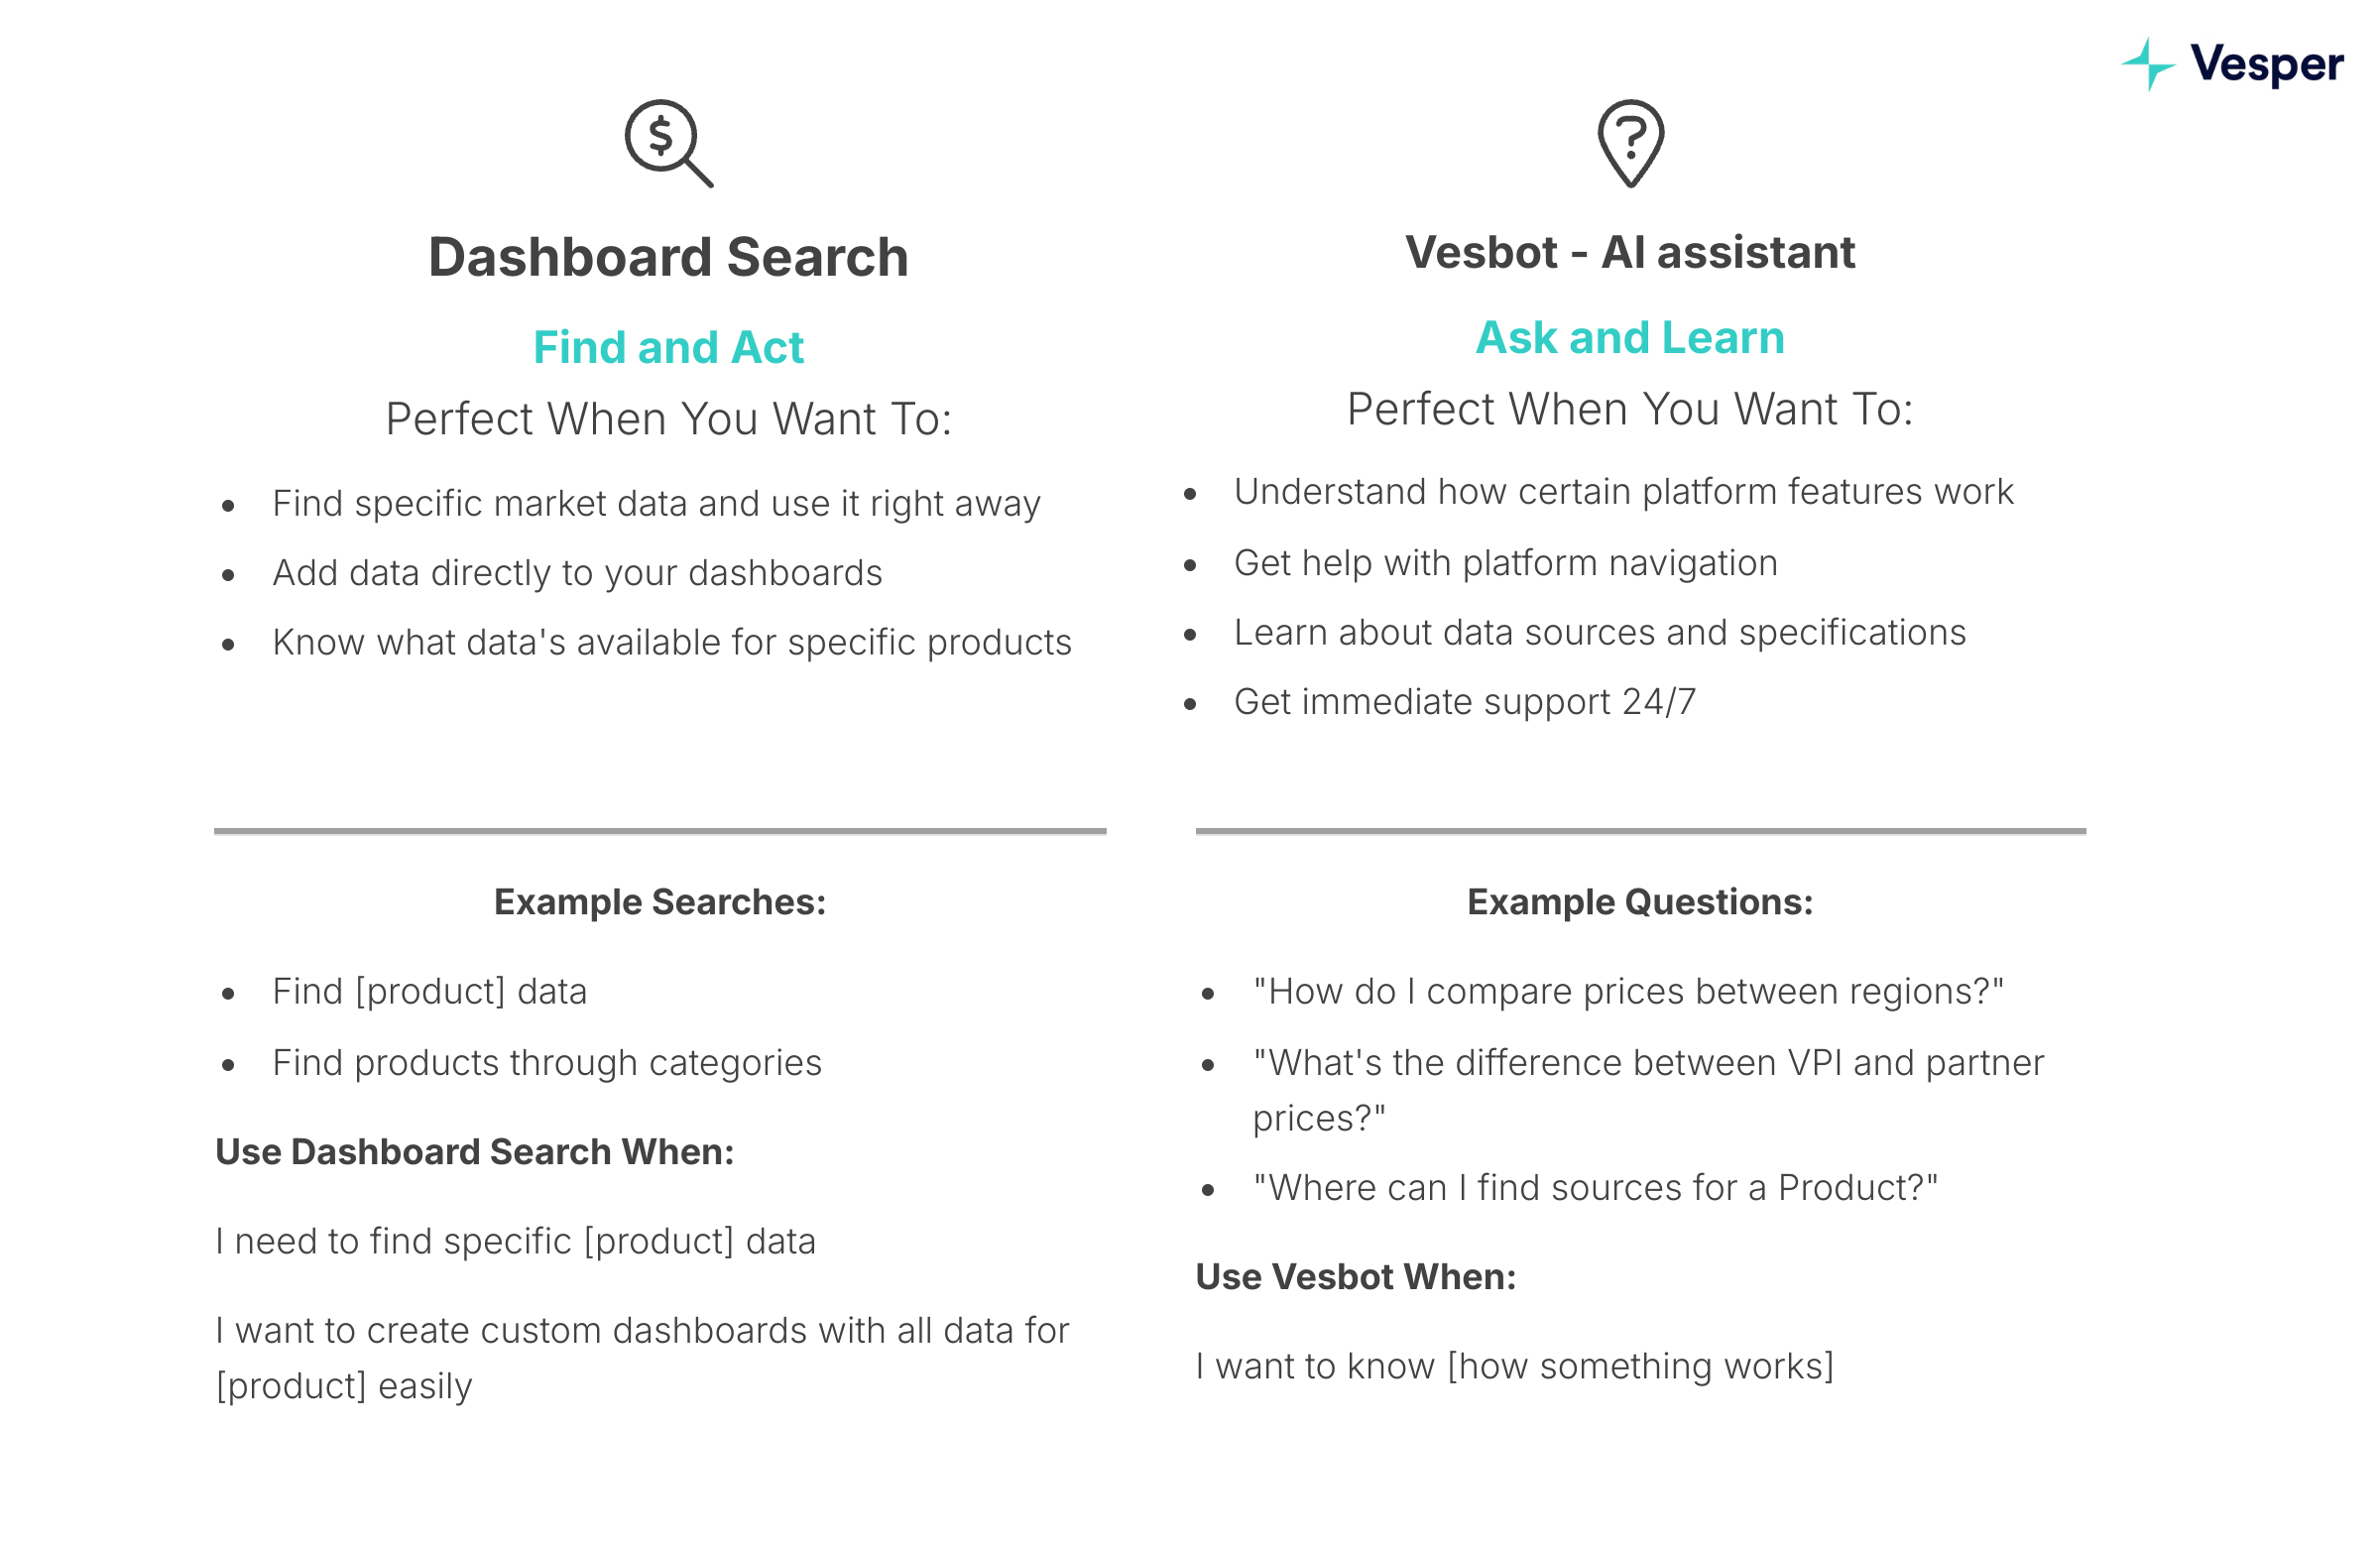
Dashboard Search: Find and Act

Two simple ways to discover available data:

  1. Direct product search

    • Search for specific products (e.g., "WPI", "Sugar", "Cocoa")

    • See all available data types for that product

    • Add relevant data directly to your dashboards

  2. Category navigation

    • Browse through product categories

    • Select product within the category

    • Explore available data types

Both paths help you discover and organize the data you need in your dashboards.

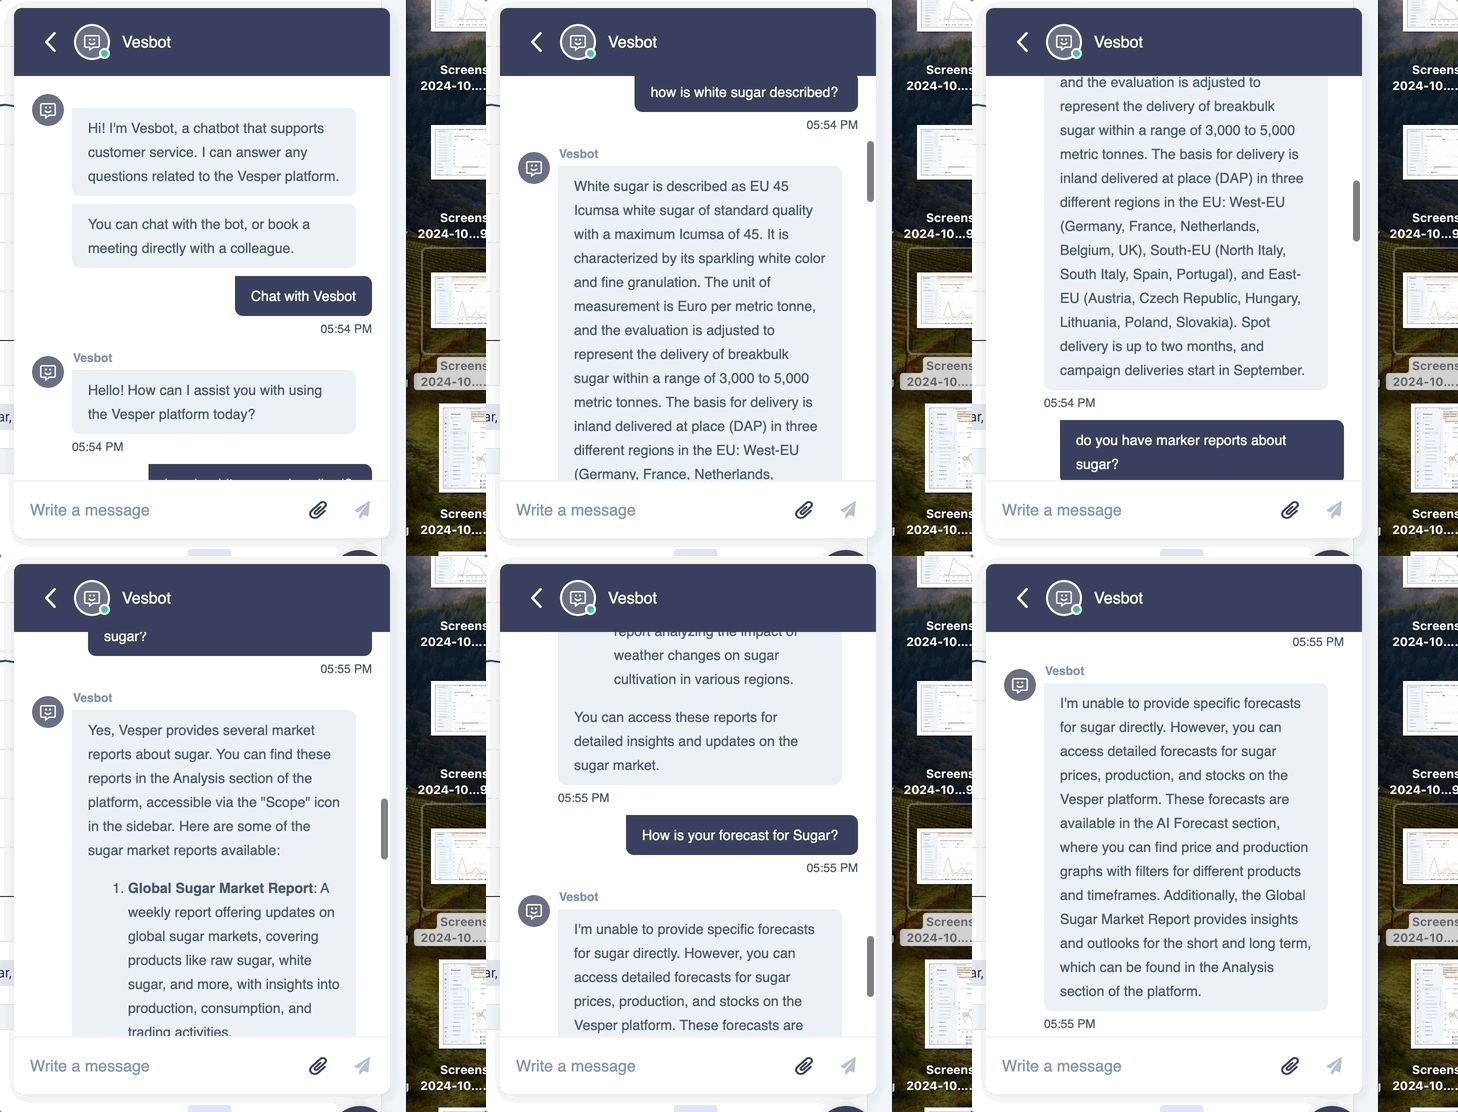
Vesbot: Ask and Learn

  • Get instant answers about platform features

  • Learn how to use specific platform capabilities

  • Access platform support 24/7

  • Available through the help icon in the bottom right corner

Why It Matters

Finding the right data and understanding how to use it are crucial for making timely decisions. Dashboard Search helps you quickly locate and organize market data, while Vesbot ensures you can instantly learn how to use platform features effectively.

When To Use Which?

How to Use It

Dashboard Search

  1. Click the search bar above your workspaces

  2. Enter what you're looking for (e.g., "WPI prices")

  3. Add Country/region

  4. Add relevant data directly to your dashboards or create a new one

Vesbot

  1. Click the help icon in the bottom right corner

  2. Type your question (e.g., "How do I compare prices between regions?")

  3. Get immediate answers and guidance

  4. Follow up with additional questions if needed

  5. Left with questions? Our Support team is still available to help, just ask Vesbot to connect you.

Did you like this update?

LikeNeutralDislike

Introducing Vesbot: Your AI Chat Assistant πŸ€–

by Vesper Team
New
Improvement


Meet Vesbot, your new AI-powered platform Support! We're optimizing how you find resources, information and get support to best get Value from using Vesper.

What Vesbot Can Do

Get instant answers about:

  • Where to find certain data

  • Report availability

  • Source information

  • Product specifications

  • Delivery details

  • Platform features and functionality

Smart Support Routing

Need human assistance? Simply ask Vesbot to connect you with our Support team – it's that easy!

How to Access

Find Vesbot in the platform's chat functionality by clicking the Help button in the bottom right of the screen.

Don’t worry, we still pick up the phone!

You can reach us through the phone or whatsapp on: +31 6 43 21 20 19

Send an email to [email protected]

Add Average Line to Price Charts with One Click

by Vesper Team
New
Improvement
Vesper Toolbox

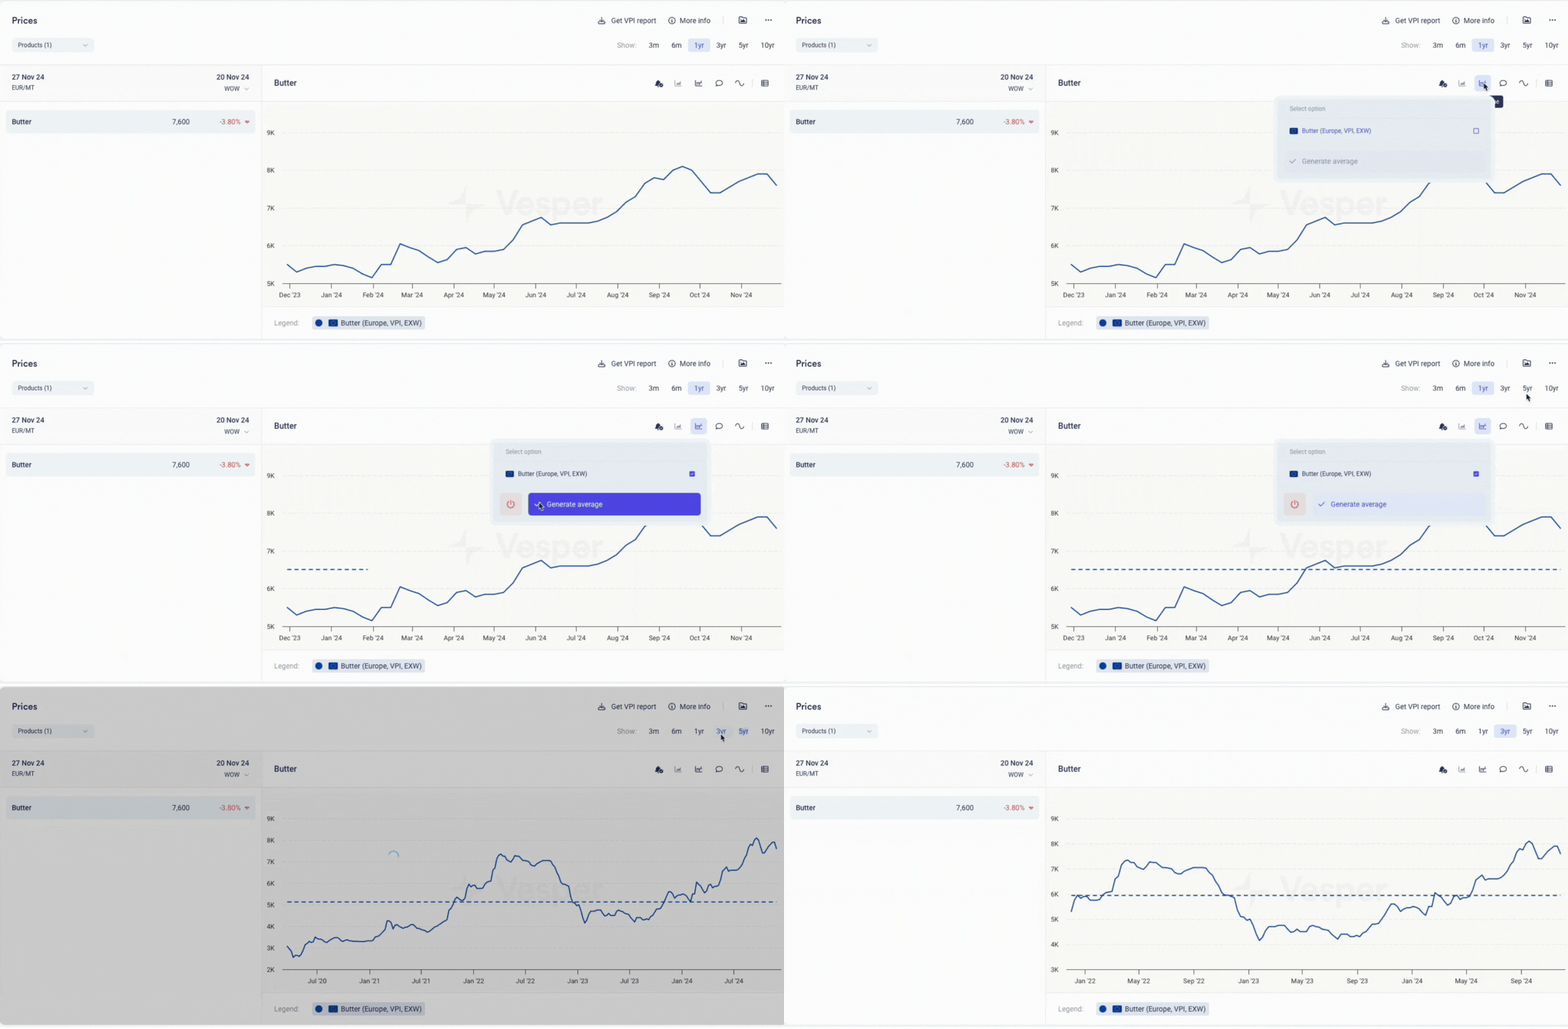
Summary: Added one-click average line functionality to price widgets, automatically adjusting to your selected time frame.

What's New:

  • Average line button in price widgets

  • Automatic calculation based on selected timeframe

  • Updates when time frame changes

Why It Matters: Quickly visualize price trends against historical averages to better understand market movements and support your decisions.

How to Use It:

  1. Open any price widget

  2. Click the Average line button at the top

  3. Adjust time frame as needed in top right

Did you like this update?

LikeNeutralDislike

Custom News Alerts πŸ—žοΈ

by Vesper Team
New
News & Alerts
Improvement

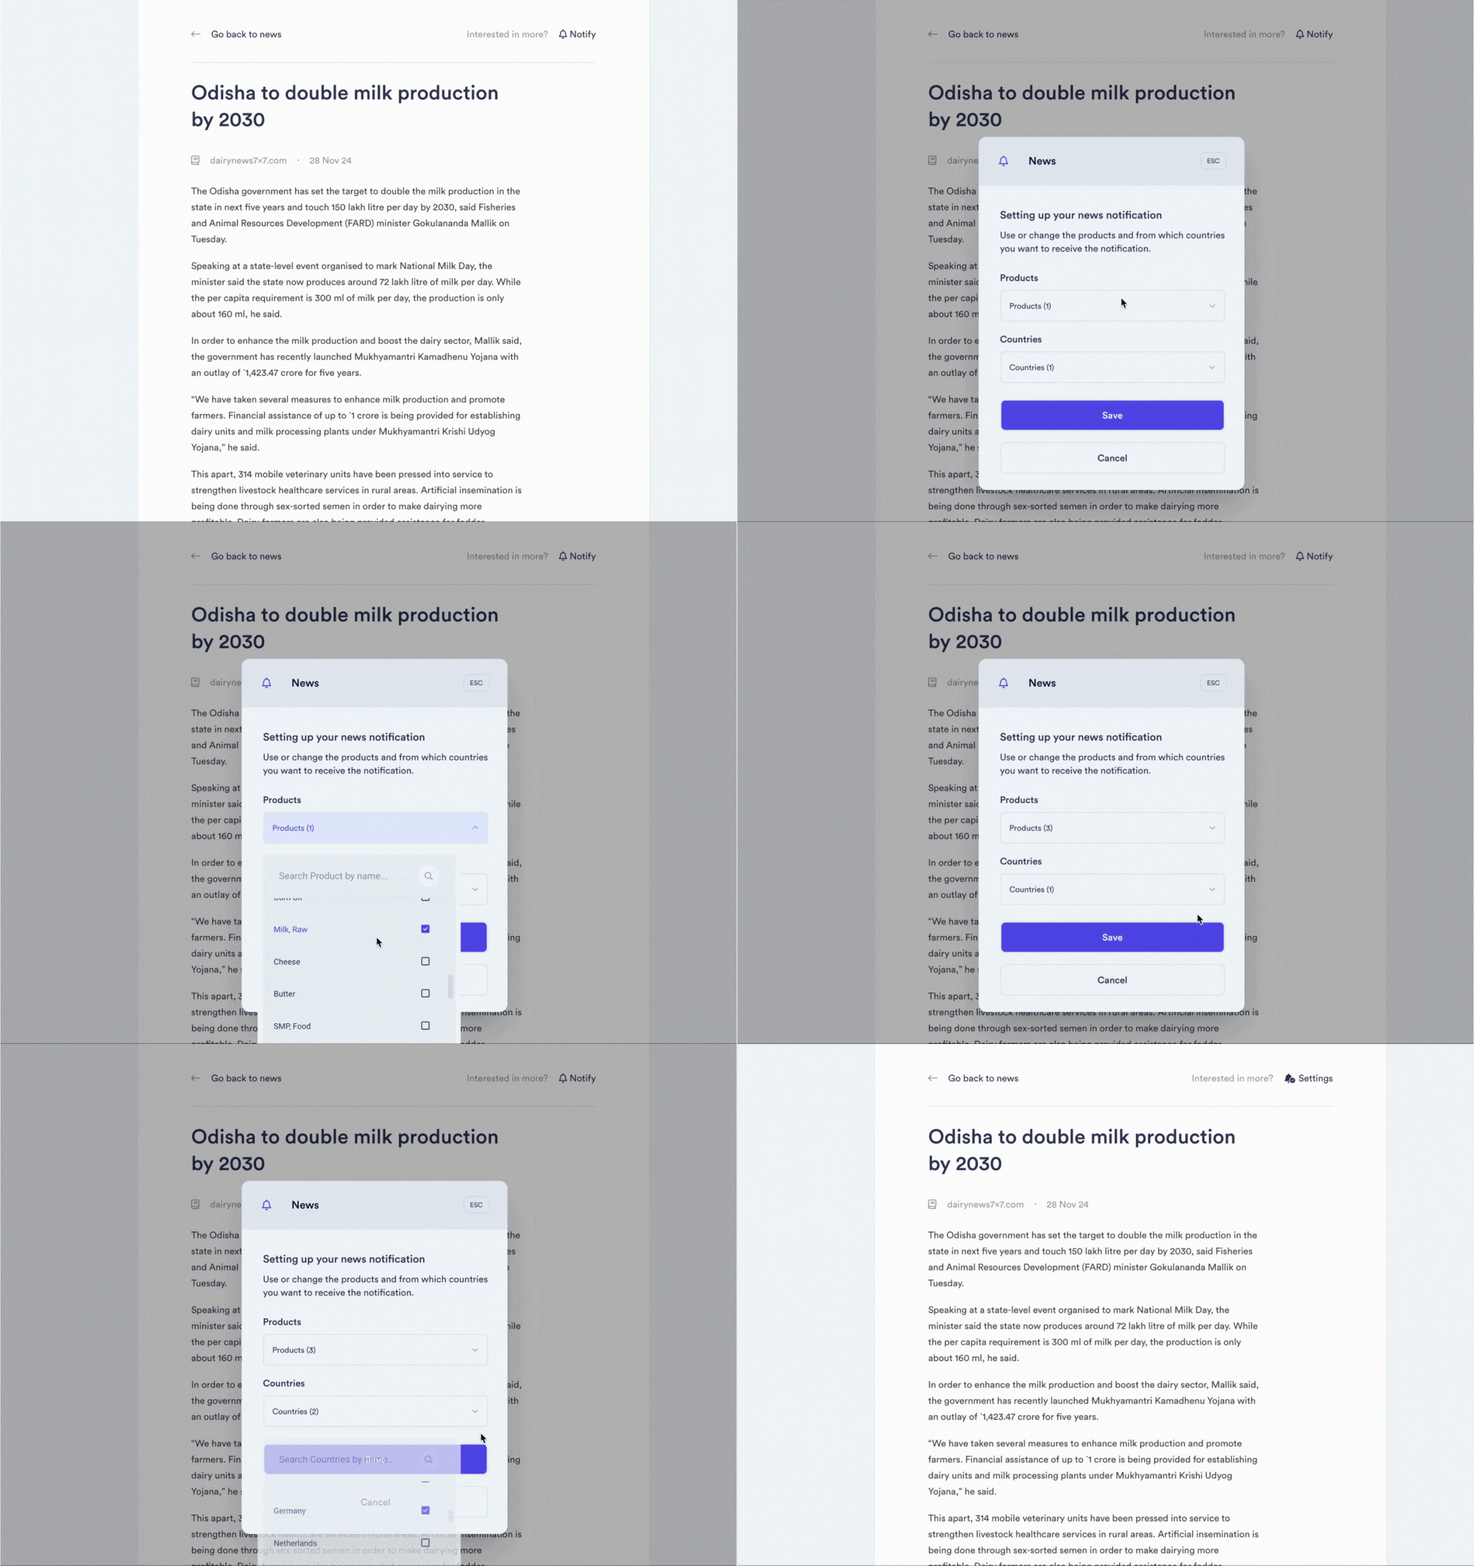
Summary: Added customizable news alerts that notify you when articles match your selected keywords or regions.

What's New:

  • Keyword-based news alerts

  • Regional news tracking

  • Notification preferences

  • Quick setup via notify button

Why It Matters: Stay informed about market movements that matter to you without manually checking for updates.

How to Use It:

  1. Click the notify button in news section

  2. Enter your keywords or regions

  3. Save your settings

  4. You can edit your notifications from your account settings

Go to your News section

Did you like this update?

LikeNeutralDislike

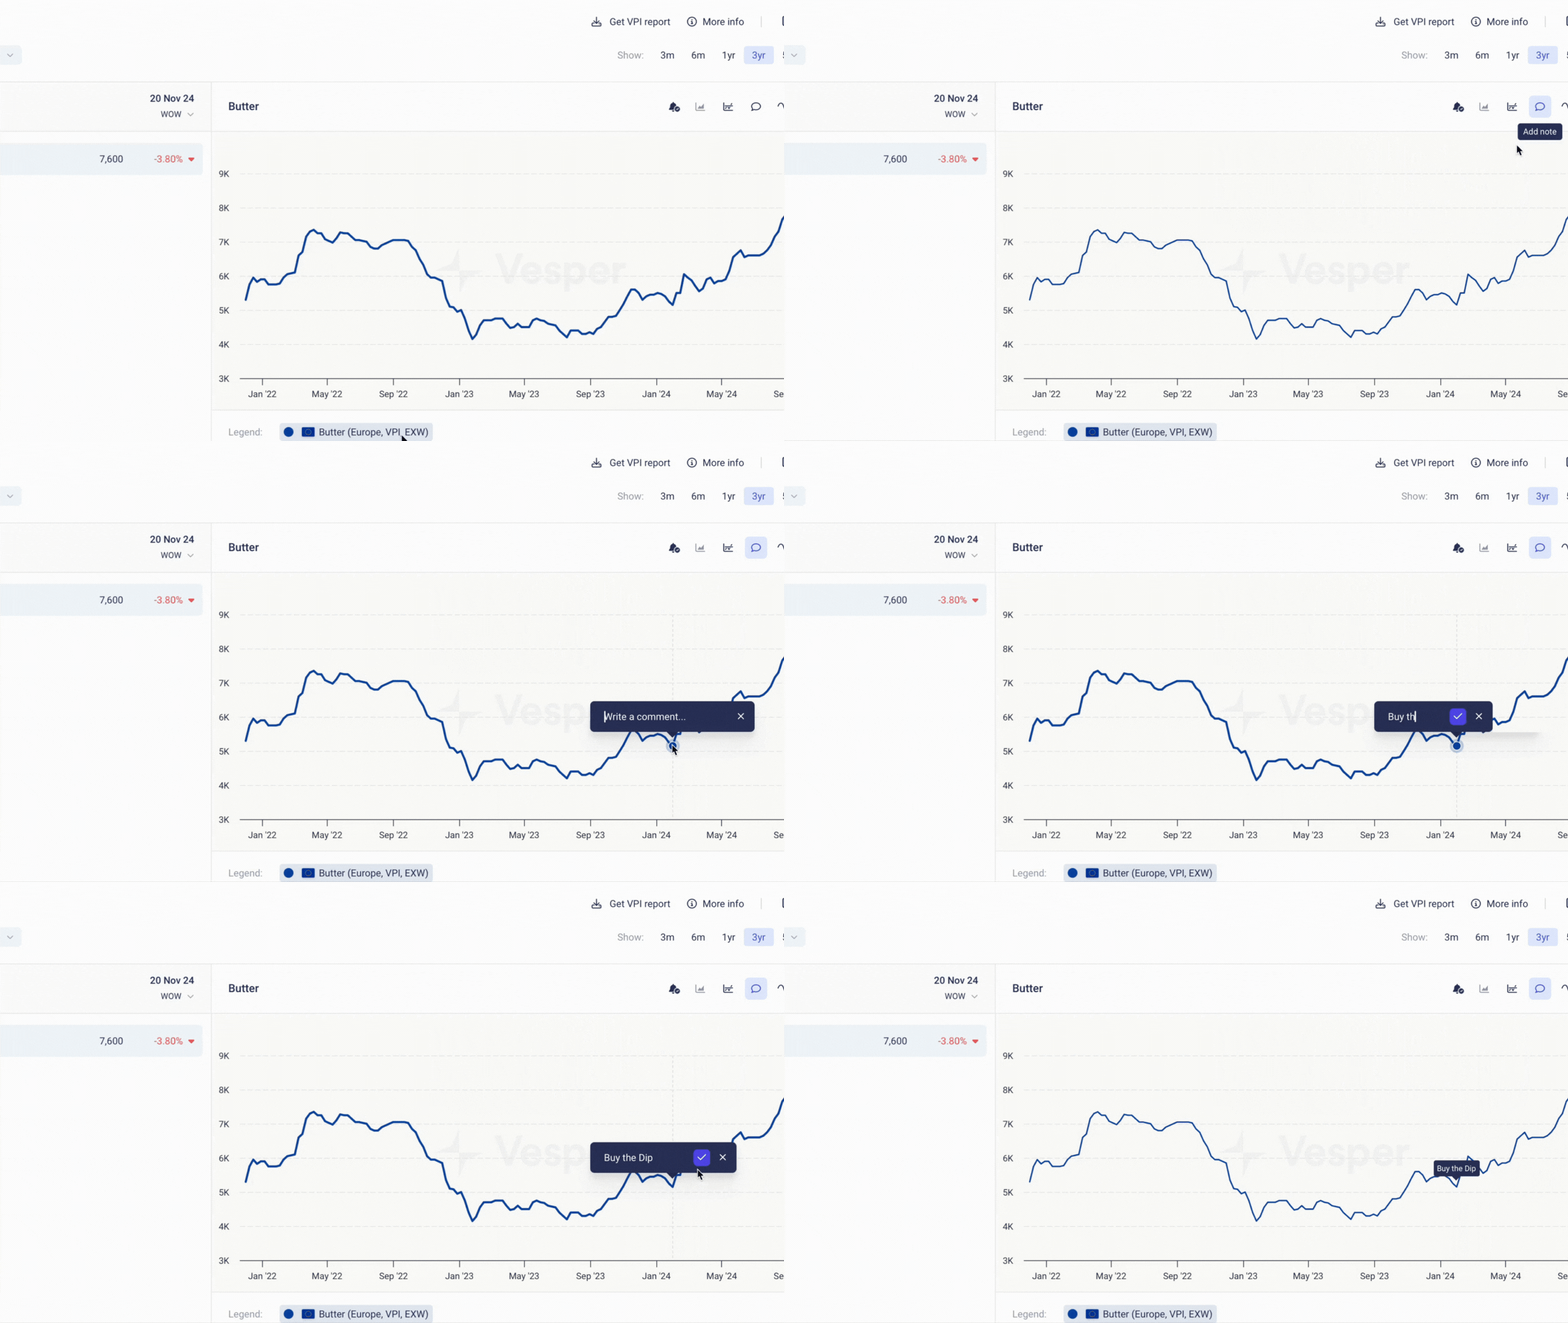
Add Notes Directly to Price Graphs

by Vesper Team
New
Improvement
Vesper Toolbox

Summary: New notes feature lets you add annotations directly to price graphs, saving context right where you need it.

What's New:

  • Note-taking mode in price graphs

  • Save annotations to graphs

  • Notes are saved until deleted

Why It Matters: Keep market context, insights, and key events tied directly to your price charts for better analysis.

How to Use It:

  1. Click notes icon on price graph

  2. Click where you want to add note

  3. Enter your annotation

  4. Click icon again to exit note mode

Pro tip: Notes stay visible when downloading or sharing graphs - perfect for presentations!

Did you like this update?

LikeNeutralDislike

New Spread View Controls: Flip Price Comparisons with One Click

Improvement
Vesper Toolbox

Summary: Enhanced pricing widgets now let you reverse spread calculations between products instantly, giving you more control over how you analyze price relationships.

What's New:

  • Added flip button in spread view to reverse calculation direction
  • Instant recalculation of price differences
  • Consistent across all pricing widgets
  • Preferences stay saved for future sessions

Why It Matters: Price spreads often need to be viewed from different angles depending on your role or analysis needs. This flexibility helps you spot opportunities and analyze relationships exactly how you need them, without manual recalculation.

How to Use It:

  1. Open any pricing widget with a spread view
  2. Look for the new flip icon next to your spread calculation
  3. Click once to reverse the price difference calculation
  4. Your preference saves automatically for next time

Use Case Example: When analyzing relationships between related products, like SMP and WMP, you can now quickly switch between viewing "SMP minus WMP" or "WMP minus SMP" to match your typical trading perspective or reporting format.

β†’ Try it now in your pricing widgets: [Direct Link] Need help? Contact your customer success manager or email [email protected]